Qatar LNG: why Hormuz recovery will be slow and uneven
July 3, 2026
Qatar’s LNG recovery: why shipping risk, not liquefaction, sets the pace
The signing of the US–Iran memorandum of understanding (MoU) on 14 June prompted a sharp market reaction. TTF prices fell and traders began pricing a relatively swift resumption of Qatari LNG exports, with the forward curve suggesting the worst of the supply shock was over. We did not share that assessment, and subsequent events have reinforced our view that the recovery of transit through the Strait of Hormuz will be gradual and stop-start.
JKM–TTF spreads, LNG freight diffs, $/MMBtu
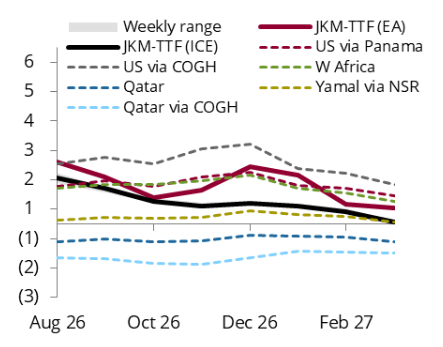
Note: Freight diffs are the increases in freight costs to send cargoes to Northeast Asia instead of Europe
Source: ICE, CME, Fearnleys, Argus Media Group, Energy Aspects
The bottleneck is not Ras Laffan
The key misunderstanding in the market has been treating this as primarily a liquefaction problem. Our data show approximately 2.1 Mt of liquefaction capacity currently online at Ras Laffan, with around 10 ballast LNG carriers anchored nearby with an aggregate loading capacity exceeding 1 Mt. The physical infrastructure to load and despatch cargoes exists. The constraint is getting those cargoes through the Strait of Hormuz.
QatarEnergy has been notifying buyers that deliveries could ramp up rapidly, with initial indications of allocations broadly around 50% of annual contracted quantities. That broadly aligns with our 2026 Qatari LNG export forecast of 38.7 Mt — roughly half of pre-conflict export capacity — but those notifications carry transit-related caveats. We view the MoU framework as fragile, with shipping risks reflecting a new status quo in which military pressure is used as leverage over implementation and any future settlement.
A fragile corridor, not a safe shipping lane
Events of late June illustrate why caution is warranted. Iran launched drone attacks on the cargo ship ‘Ever Lovely’ on 25 June and the crude tanker ‘Kiku’ on 27 June, targeting vessels using the Omani corridor without Iran’s approval. The US launched retaliatory strikes before both sides agreed a temporary halt. Two LNG carriers, ‘Gaslog Shanghai’ and ‘Umm Slal’, reversed course after initially heading towards the Strait.
The diplomatic process has also slowed. Plans to resume talks in Switzerland stalled over the weekend, with the US and Iran now expected to hold only indirect technical discussions in Doha. Iran will continue to use its leverage over the waterway to shape ongoing diplomacy. The Omani corridor remains a temporary workaround; it is not a functioning replacement for the main commercial shipping lane.
Asia is restocking, but the signals are mixed
A slow recovery in Qatari exports matters because Asian demand for those volumes is real. Several markets ran down storage and deferred industrial demand during the initial months of the conflict and are now in restocking mode.
| Country | Analysis |
|---|---|
| India
|
India's June LNG imports are tracking at 2.4 Mt , some 0.4 Mt above our start-of-month estimate, as buyers replenish inventories and linepack following the disruption to baseload Qatari supply in Q2 26. Energy-security guidance encourages higher inventory buffers. Industrial demand is also recovering, with Morbi ceramics gas burn running at 7–8 mcm/d since May from April lows. We have revised our bal-2026 Indian LNG import forecast up by 0.2 Mt w/w to 13.8 Mt , 0.4 Mt higher year on year. |
| South Korea
|
South Korea has also tightened the Pacific balance, with import demand revised up by 0.4 Mt w/w on higher inventory builds. |
| China
|
China's picture is different. The 1.5 Mt month-on-month increase in May was driven by elevated power-sector gas demand, with node prices in some coastal provinces reaching above $0.23/kWh during peak hours. But cooler temperatures and rainfall through late June and early July are reducing cooling demand and easing power-sector gas burn. Broader buying interest remains subdued. We forecast China's Q3 26 LNG demand at around 5.8 Mt per month — broadly flat year on year. |
What this means for Europe’s winter
European storage outlook — base case
End-October 2026 forecast:
Compared to:
Our base case has Europe filling storage to around 85.7 bcm (78%) by end-October — about 4.7 bcm lower year on year and 11.7 bcm below the five-year average. That is enough for a mild or normal winter, but falls short of what a cold one would require. Europe has limited supply-and-demand flexibility, with the coal-gas switching channel diminishing in recent years as the region phases out coal, leaving gas to absorb most of any cold-weather demand shock.
The El Niño weather pattern poses a further upside risk to TTF prices in Q3 26: stronger cooling demand across Asia would intensify competition for Atlantic basin cargoes and could push prompt TTF prices above €45.00/MWh and further challenge the pace of the stockbuild.
The divergence between diplomatic headlines and physical market reality is likely to persist through the injection season and into winter.
Our Global LNG service tracks Qatari export forecasts, shipping constraints, Asian demand balances and European storage trajectories on a weekly basis, providing the granular picture needed to navigate a market shaped more by transit diplomacy than by liquefaction capacity.
Recent Posts