


In energy markets, opinion is cheap. Data is cheaper. Learn how EA Analytics brings together what's happening, what it means, and what comes next.

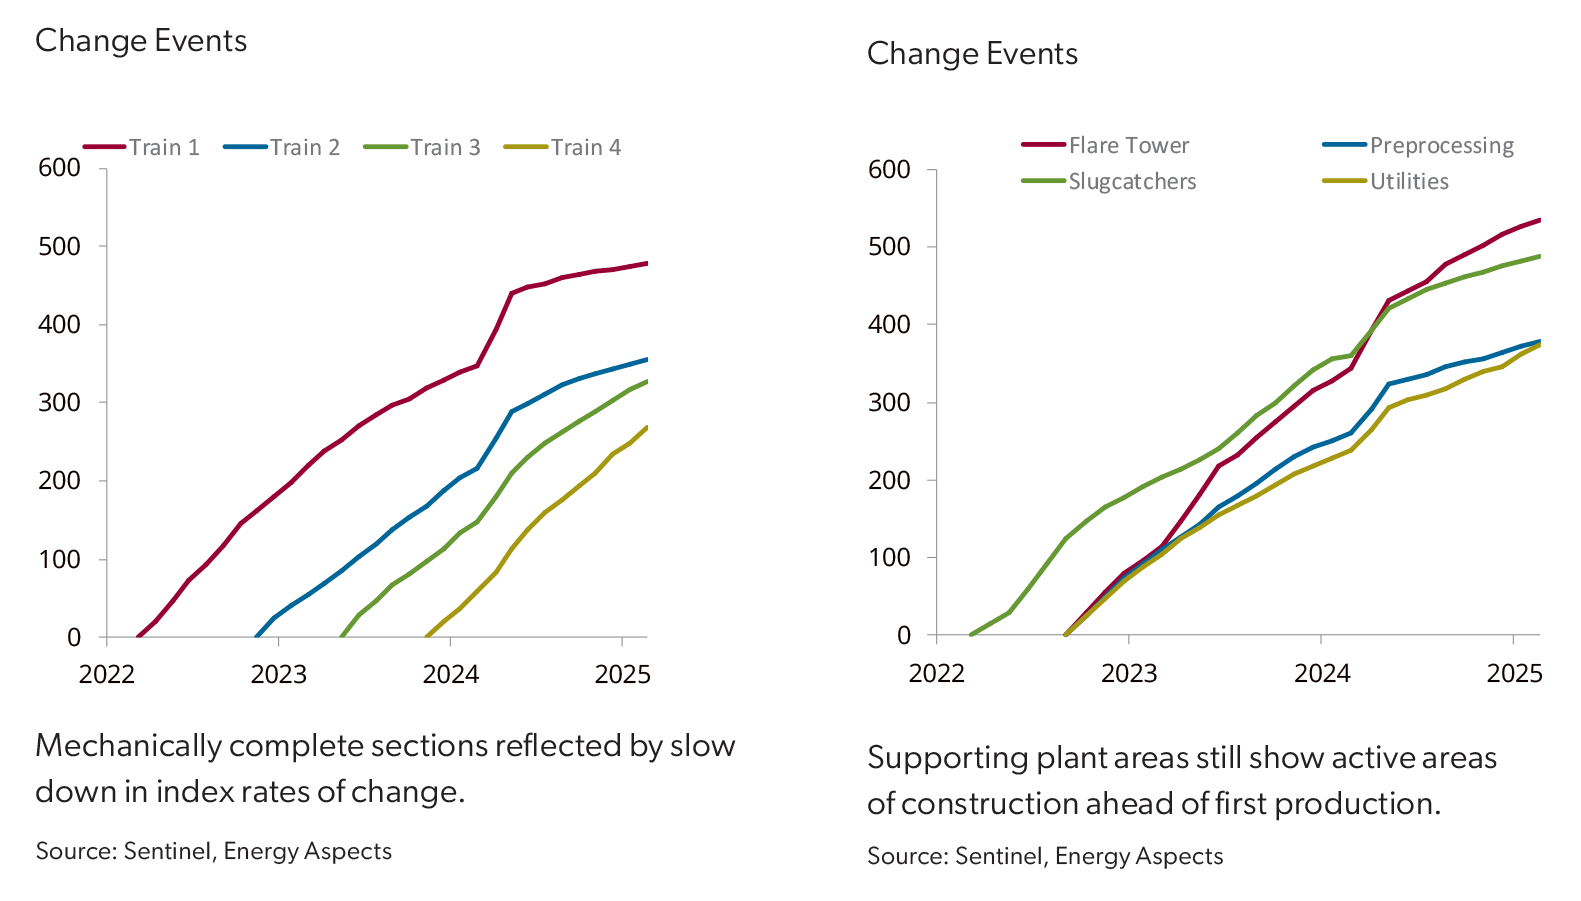
Iran's attacks on Hormuz vessels show why Qatar's LNG recovery will be slow. We explain what this means for Asian and European gas markets.
EU gas storage stands 15 bcm below the five-year average. Our analysis explains why TTF prices need to stay elevated through summer.