



Truck Traffic Indices

Industry-leading intelligence on truck traffic and road diesel demand

Track trucking activity in near real-time with Energy Aspects’ satellite-derived Truck Traffic Indices. Covering the US, China, and all major European countries, our proprietary algorithms deliver daily intelligence, often months ahead of official statistics. 


In markets like China, our indices provide unique visibility where official data is delayed or unavailable. Coverage is expanding to North Africa and the Middle East.

Truck Traffic Indices

Energy Aspects’ Truck Traffic Indices are market leading alternative data, strongly correlated with road diesel demand and economic

activity. With this data, EA empowers a wide range of users including traders, analysts, macro forecasters, and quantitative strategists to anticipate shifts in fuel demand, optimise trading strategies, and support macroeconomic and factor-based analysis.

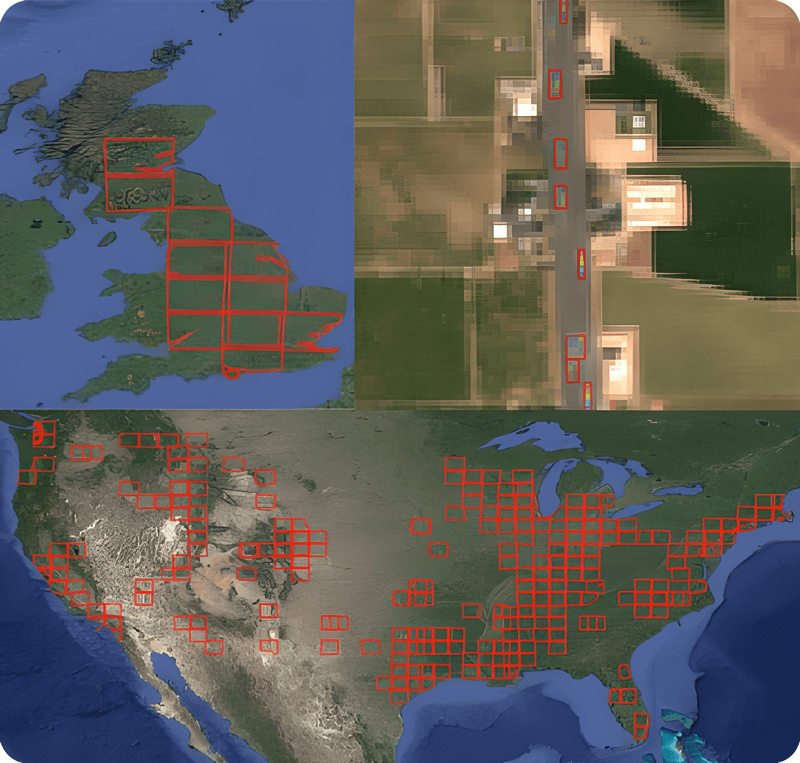
Sentinel tile selection

Sentinel tile selection - Truck Traffic Indices

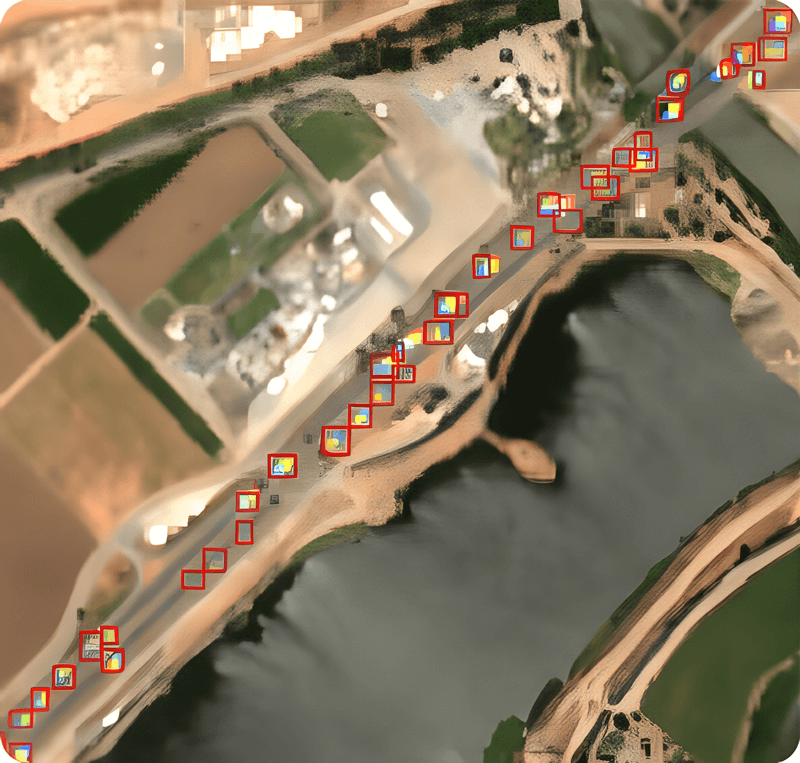
Detected trucks

Detected trucks via Truck Traffic Indices
Truck

Gain strategic advantage

Gain daily, high-frequency trucking data to support fuel demand analysis, anticipate market shifts, and inform trading strategies across key global regions.

High frequency


Receive daily updates, providing near real-time visibility into trucking activity and road diesel demand.


Extensive coverage


Indices cover the US (with regional breakdowns by PADD), China, and all major European economies, with expansion into North Africa and the Middle East.

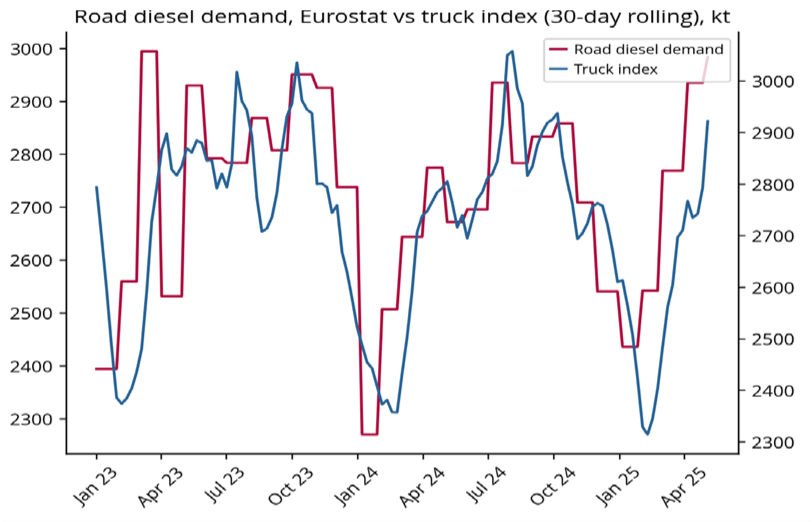
Germany index vs road diesel demand

Germany index vs road diesel demand - EA Portal Graph

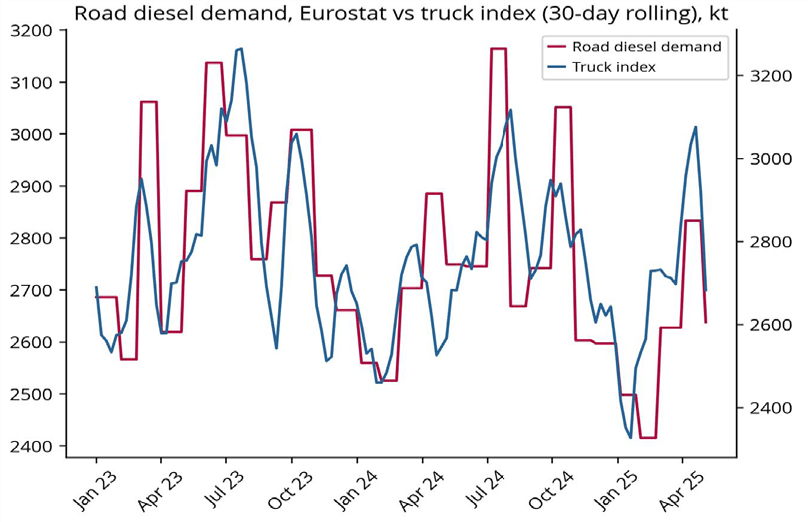
France index vs road diesel demand

France index vs road diesel demand - EA Portal graph

Proven correlation


Our indices are validated against public data where available and are highly correlated with road diesel demand and macroeconomic indicators.


Robust methodology


Built on proprietary algorithms and satellite-derived data, our methodology delivers reliable, alternative data months ahead of official statistics.

Technical specifications

Explore the technical details of our truck traffic indices.

Timing:


Data is updated daily (calendar days), ensuring timely insights for your analysis.

Formats and integration:


Access data via CSV, Excel, API, or EA portal access (dashboard coming soon), making integration seamless.

Data source:


Sourced from ESA Sentinel-2 satellite imagery, providing consistent and reliable coverage.

Historical data and coverage:


Data available from 2023 onwards.

Recent insights

Low stocks and China's return put a floor under crude
August 13, 2026
Our Kayrros inventory data show global crude stocks far below pre-conflict levels, with SPR releases slowing and Chinese buying recovering.

July 10, 2026
The market is slowly abandoning the binary Hormuz recovery paradigm but has yet to price the unwinding of the coping mechanisms that have softened the disruption’s impact on energy markets. The most significant adjustments have come from China. By cutting crude imports, slashing refinery runs, halting strategic reserve filling, curtailing product exports and pivoting refiners from petrochemicals to transport fuels, Beijing has bought the market precious time as the disruption hits 100 days.

OilX to EA Analytics: Real-time energy intelligence
July 7, 2026
In energy markets, opinion is cheap. Data is cheaper. Learn how EA Analytics brings together what's happening, what it means, and what comes next.