US crude stocks at their lowest since 1985

June 19, 2026


US crude at its lowest since 1985: reading the balances across all barrels 


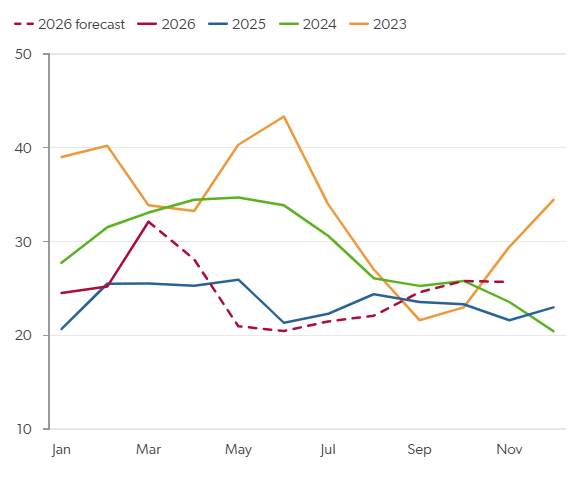
US crude inventories drew sharply in the week ending 12 June, taking total stocks including the SPR to their lowest level since 1985. Cushing fell to under 21 mb, near operational minimums. The headline numbers are notable, but they do not stand alone. Cushing tightness looks to be solved through higher Permian inflows, while the 40 mb 10 June SPR exchange should add more supply to PADD 3, just as the international pull softens following the 17 June signing of the US–Iran memorandum of understanding. A larger-than-expected draw takes stocks to multi-decade low.

Total Crude Draw

−8.3 mb

vs EA revised forecast of 4.5 mb

Refinery Runs

+0.23 mb/d

w/w; highest level since August 2025

Cushing Decline

−1.6 mb

New five-year low

PADD 2 Stocks

Since 2014

Lowest level

EIA data for the week ending 12 June showed total crude stocks drawing by 8.3 mb, against our revised forecast of 4.5 mb. Refinery runs exceeded our forecast, rising by 0.23 mb/d w/w to their highest level since August 2025, while waterborne imports underperformed our cargo tracking data. Both factors contributed to the larger-than-expected draw. 

At Cushing, inventories declined by 1.6 mb to a new five-year low. PADD 2 stocks fell to their lowest level since 2014, driven by a combination of unplanned Western Canadian production outages and seasonal increases in Midwest refinery runs.


Our market soundings point to slow flow rates on the Enbridge Mainline and widespread batch advancement requests from Midwest refiners, consistent with very tight near-term supply conditions in the Midcontinent.

Cushing inventories, mb

EIA data for the week ending 12 June showed total crude stocks drawing by 8.3 mb, against our revised forecast of 4.5 mb. Refinery runs exceeded our forecast, rising by 0.23 mb/d w/w to their highest level since August 2025, while waterborne imports underperformed our cargo tracking data. Both factors contributed to the larger-than-expected draw.
At Cushing, inventories declined by 1.6 mb to a new five-year low. PADD 2 stocks fell to their lowest level since 2014, driven by a combination of unplanned Western Canadian production outages and seasonal increases in Midwest refinery runs. Our market soundings point to slow flow rates on the Enbridge Mainline and widespread batch advancement requests from Midwest refiners, consistent with very tight near-term supply conditions in the Midcontinent.

Source: EIA, Energy Aspects

Why Cushing tightness is not translating into wider WTI timespreads 

Despite inventory levels near operational minimums, we do not expect Cushing to drive a sustained WTI timespread rally. Low Cushing inventories attracted higher Permian inflows, improving DSW blending economics and reducing the risk of prompt NYMEX WTI tightness from a shortage of physically deliverable crude. Near-dated WTI cash roll differentials confirm that DSW availability is already improving at Cushing.


We view July Cushing balances as solved and expect the WTI–Brent spread to start reversing as the US-Iran MoU should free up more crude, reducing the international need for US barrels. The US remains the most well-supplied crude region and must discount to clear. 

Products: diverging signals across gasoline, diesel and jet


Product balances for the week showed a mixed picture.

Gasoline


Gasoline drew by 0.9 mb against our forecast of a 0.3 mb stockbuild, with imports into PADDs 1 and 5 coming in below our expectations and combined product supplied and exports exceeding our forecast. A 0.2 mb/d Trainer refinery outage from 16 June, affecting multiple gasoline units and expected to last over a week, will weigh on PADD 1 production in next week’s EIA data. We are tracking PADD 1 arrivals of 0.6 mb/d for the week ending 19 June; these should broadly offset the production loss, and we anticipate a 1.3 mb US gasoline stockbuild in next week’s print.


Diesel


Diesel built by 1.0 mb against a forecast 0.6 mb draw, as exports and product supplied fell short of our estimates. PADD 1 diesel stocks remain very low, but rising HO–GO spreads are expected to cap further export loadings to Europe, limiting near-term draws.


Jet fuel


Jet saw the sharpest miss: a 1.1 mb draw against a 0.1 mb forecast. USGC regrades fell by over 12 c/gal w/w, contrary to our expectations. With the MoU announcement raising the prospect of recovering east–west flows, we expect USGC jet export demand to slow further, weighing additionally on regrades. We forecast a 0.7 mb US jet stockbuild in next week’s data.


NGLs: export headwinds and rising production point to a summer propane build 

US propane/propylene stocks rose by 3.0 mb w/w to 87.4 mb, building across all PADDs and led by PADD 3. The build came on lower product supplied and weaker exports, with Asian propane flows down by nearly 0.6 mb/d w/w. Late-June cargo cancellations are running ahead of expectations, and our market soundings indicate at least eight further USGC loadings have been cancelled in July owing to elevated prompt freight rates and marginal arb economics. 


The MoU is reinforcing the wait-and-see mood among Asian LPG buyers, as they anticipate lower prices with a recovery in Hormuz traffic. US propane/propylene production is set to rise, with the GCX pipeline expansion in the Permian ramping up and Energy Transfer’s Hugh Brinson gas pipeline due online in Q3 2026. 


Our Crude Oil, Oil Products and LPG services track weekly supply, demand and trade flow data across all major US regions and pricing hubs, with analysis extending from the Midcontinent through to USGC export markets and international LPG flows.

Recent Posts

Kayrros LNG intelligence
July 31, 2026
Our thermal imagery flagged Pluto Train 2’s faster commissioning weeks before Woodside’s Q2 26 report confirmed the same milestones.
EU electrification plan won't lift power demand yet
July 27, 2026
Why the EU's Electrification Action Plan is unlikely to accelerate European power-load growth before 2030, according to our Europe Power forecasts.
EU ETS Reform 2026:What the New LRF Really Means for Carbon Cost
July 23, 2026
Energy Aspects breaks down the EU ETS Commission proposals published 17 July 2026. Explore the soft LRF, MSR reforms, free allocation changes.
Show More