Kayrros LNG Intelligence
Track US data centre build-out, load timing and on-site generation with satellite-verified data.
US Data Centre Monitoring gives users a detailed view of US data centre build-out from campus to phase to individual building. The service uses optical, thermal and radar satellite imagery, machine-learning models and proprietary technology to measure construction progress, estimate load capacity and forecast when each building will reach full capacity.
Designed for power, gas and equity market participants who need an independent read on load growth, our US Data Centre Monitoring solution helps users model demand on what is actually being built rather than on developer announcements or interconnection queues. Behind-the-meter generation is tracked separately from grid load, and the point-in-time dataset is refreshed every two weeks, with delivery through dashboards, API, Excel downloads and email highlights.
For customers seeking a wider view of new supply alongside demand, the Kayrros US Power add-on extends the same satellite monitoring to solar construction, battery storage and gas generation.

Why US Data Centre Monitoring
Supporting line: Forecast US load growth with greater speed, granularity and confidence using measured construction data built for power trading and market analysis.
163 campuses
Tracked phase by phase and building by building
140.7 GW
Of data centre load tracked across the US
25 states
Covered across eight grid regions, including every major ISO/RTO
12.0 GW
Of behind-the-meter generation tracked independently of grid load
Bi-weekly updates
Full dataset refreshed every other Thursday, with point-in-time release history
Product benefits
Load forecasts built on ground truth
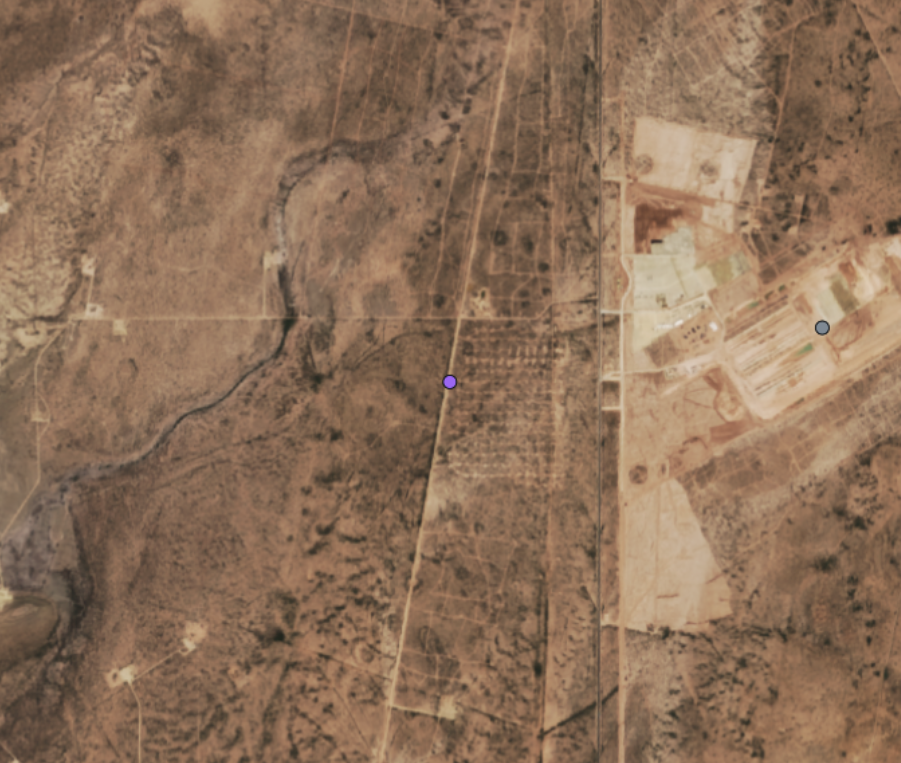
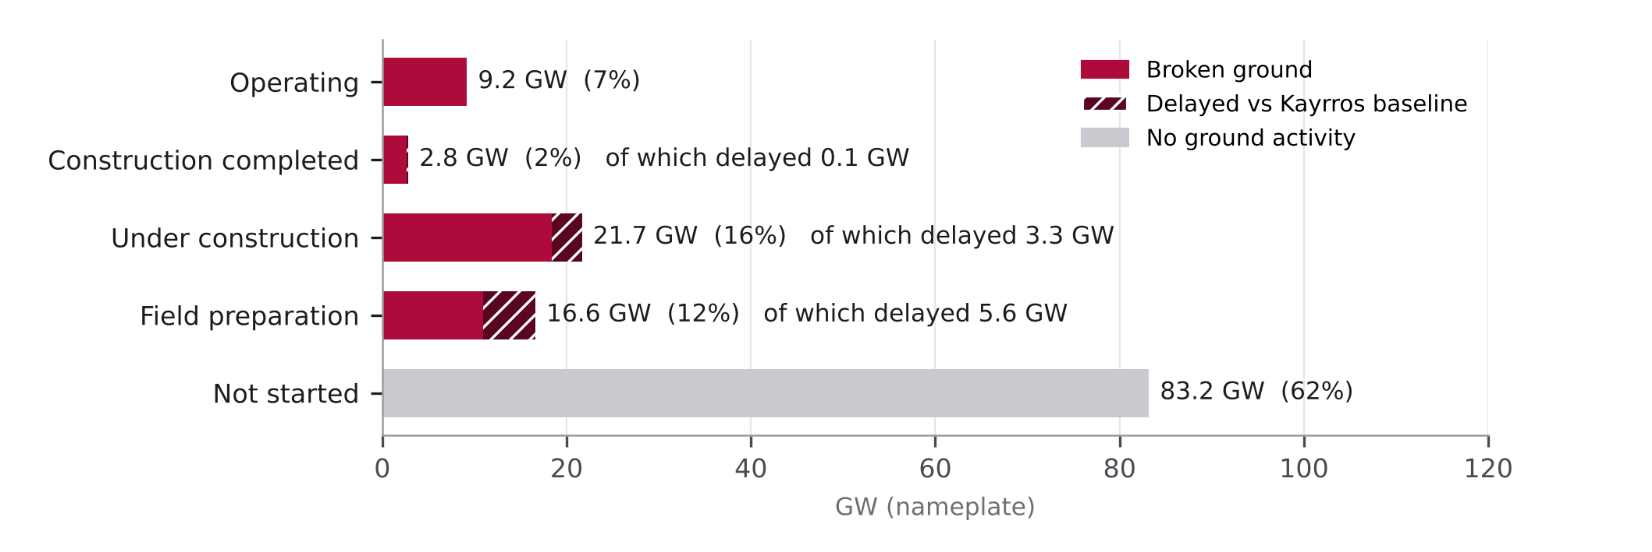
The service measures what is physically being built rather than relying on announced pipelines, interconnection queues or developer-supplied delivery dates. Construction timelines range from 6 to 38 months, and much of the announced pipeline never breaks ground: in the 2 November 2026 release, 68% of planned capacity tracked showed no ground activity.
By grounding load models in observed construction, users can remove speculative projects from their forecasts, apply realistic start-up timings and price forward power curves with greater confidence.

Building-level tracking and completion forecasts
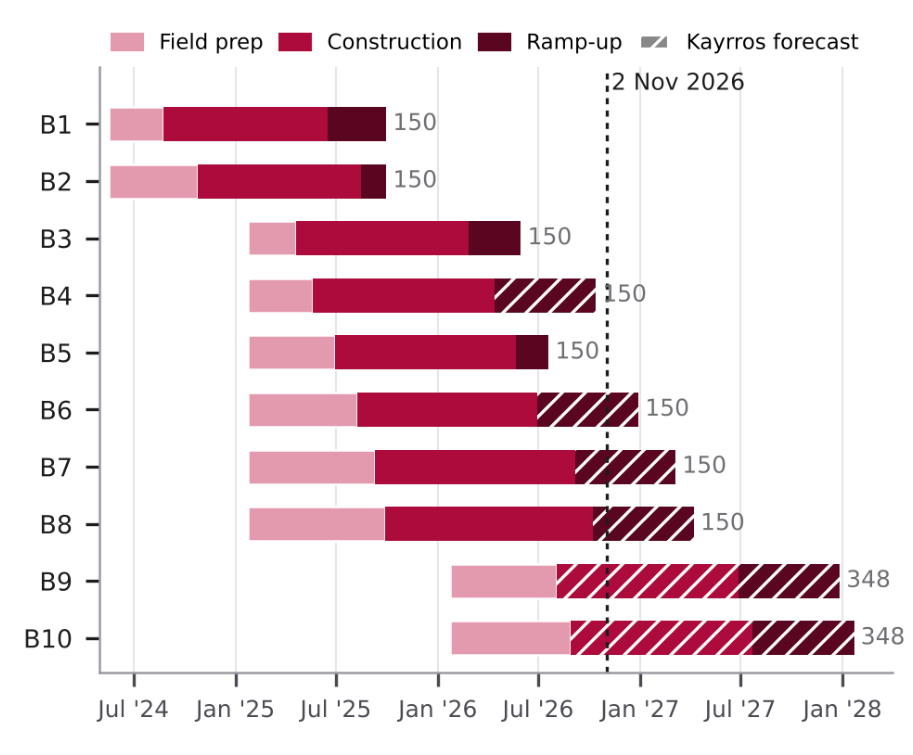
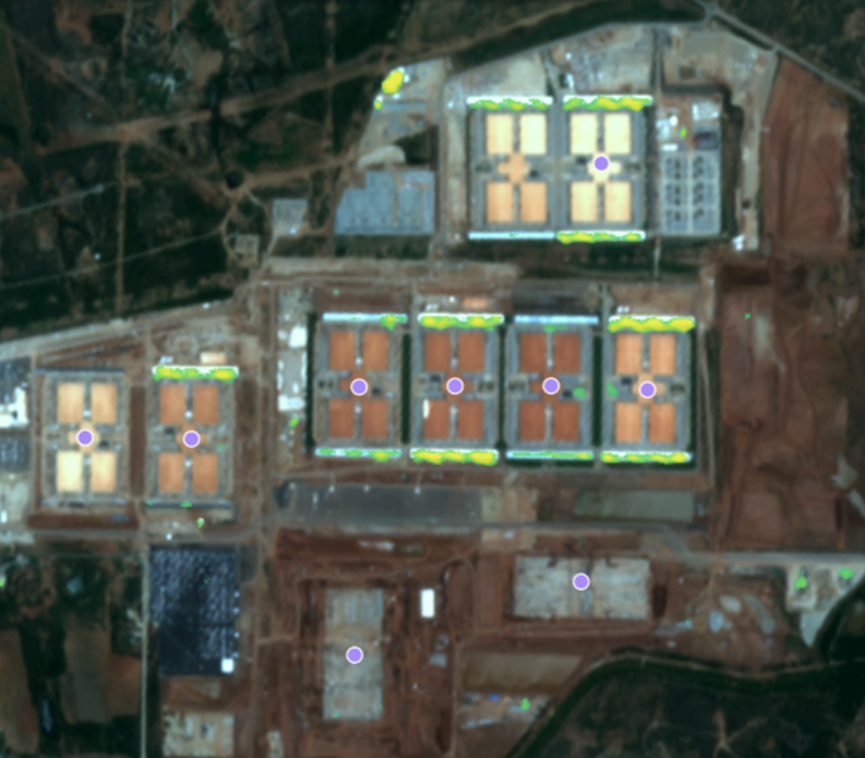
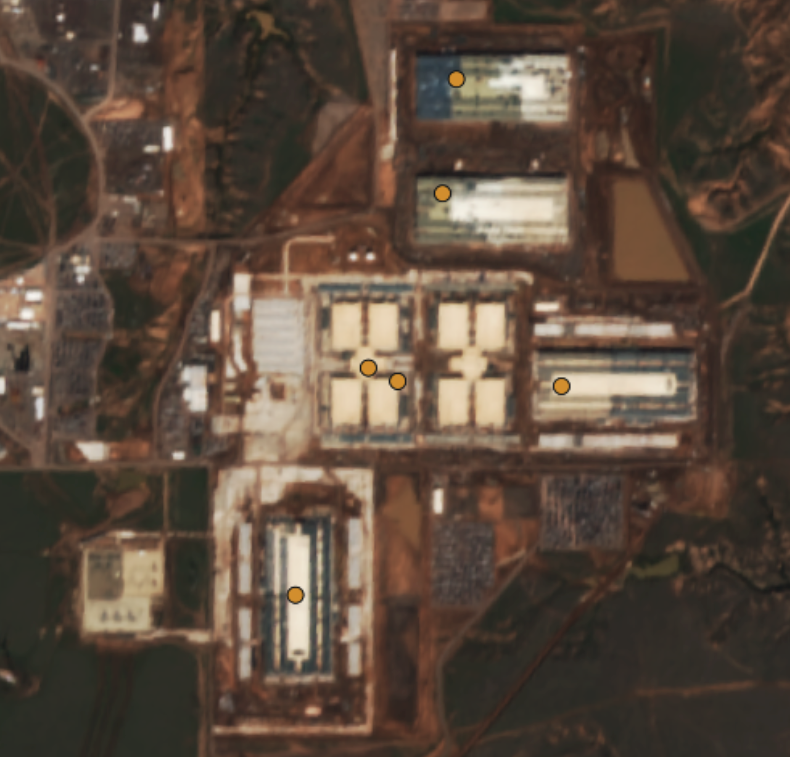
Each campus is followed phase by phase and building by building through field preparation, construction, ramp-up and operation. Optical imagery measures footprint and progress, while thermal imagery confirms when a building starts drawing power.
Every building carries a median (P50) and lower-bound full-capacity forecast, refreshed every two weeks. Buildings running behind the forecast baseline are flagged as delays emerge, often months ahead of official filings. The result is an earlier read on when net new demand will reach the grid.
Behind-the-meter generation tracked independently
Many campuses bring their own power to bypass interconnection queues. The service tracks the capacity and start-up dates of co-located gas, solar and battery assets separately from data centre load, so users can judge how much of each site's demand is likely to reach the grid and when.
On-site generation is reported beside load and never netted, letting users apply their own load factors. It also gives gas and midstream teams a campus-by-campus view of potential gas burn.


Flexible delivery for different workflows
The service is available through the Energy Aspects portal with live dashboards, REST or Python API, Excel downloads, email highlights and building-level satellite imagery. Users can work with the data in the format that best suits their process, whether that is discretionary trading, internal load modelling or systematic analysis. Point-in-time release history, with forecasts shown next to actual operating dates, supports back-testing and signal development over time.
Kayrros US Power
For customers seeking a fuller view of the US power system, the Kayrros US Power add-on applies the same satellite-derived monitoring infrastructure to new supply: See where new generation lands against new load. The add-on tracks solar construction, battery storage and gas generation build-out, so users can match emerging supply to the demand pockets created by data centre growth.
Combined with US Data Centre Monitoring, it gives a single, satellite-verified view of both sides of the balance, at asset level and on the same bi-weekly cadence. That supports load and price modelling, generation siting and PPA origination where large loads are expected to connect.

Who we serve
Supporting line: Designed for users who need an independent, timely view of US data centre load growth.

Power traders
Price forward curves and congestion risk with earlier visibility into when new load will energise, building by building and node by node.

Utility, IPP and market analysts
Replace announced pipelines with satellite-dated ramps in load forecasts, using median and lower-bound completion dates as a range for planning and balances.

Equity, gas and quantitative teams
Test hyperscaler and developer delivery claims, size on-site gas burn and back-test signals on point-in-time release history.
US Data Centre Monitoring FAQs
What is US Data Centre Monitoring?
US Data Centre Monitoring provides a satellite-verified view of US data centre construction, load capacity and behind-the-meter generation. It is designed to help users forecast load growth on what is actually being built, rather than on developer announcements.
What does the service cover?
The service covers US data centre campuses above 50 MW, tracked from announcement through field preparation, construction, ramp-up and operation. Coverage currently spans 163 campuses across 25 states and eight grid regions, and grows with every release.
How often is the data updated?
The full dataset is refreshed every two weeks, with new releases every other Thursday.
How is the data measured?
Optical imagery measures building footprint and construction progress, and capacity is estimated from footprint and power density by facility type. Thermal imagery, credible public announcements or elapsed time after construction confirm when a building is operating.
Is capacity the same as grid load?
No. Capacity is nameplate data centre load, not metered demand. On-site generation is reported alongside it and never netted, so users can apply their own load factors.
Does the service forecast completion dates?
Yes. Each building carries a median (P50) forecast and a lower-bound date for reaching full capacity, independent of developer timelines.
Is the dataset historical?
Yes. Subscribers receive the full point-in-time release history, with forecasts shown next to actual operating dates, to support back-testing.
How is the service delivered?
Users can access the service through the Energy Aspects portal dashboards, REST or Python API, Excel downloads, email highlights and building-level satellite imagery.
How does it relate to Energy Aspects' North America Power research?
The two are complementary. North America Power research provides regional and ISO-level demand and balance analysis, while US Data Centre Monitoring shows which individual projects are advancing and when.