

High-frequency data show limited consumer demand response to higher oil prices
May 28, 2026
- EA and Kayrros high-frequency indicators, among others, key to monitor end-user consumption health as rampant destocking hits demand.
- Strong backwardation in past weeks and destocking exaggerates fears of demand destruction, as shown by high-frequency data.
- Some US intermodal freight substitution creates modest downside risk, but overall US and European trucking activity remains healthy.
- Resilient jet demand outside Middle East, China, supporting our global kerosene forecast of a 1.1% y/y increase through H2 26.
- Middle East demand declines easing; rerouted trade and recovering aviation should support regional demand.
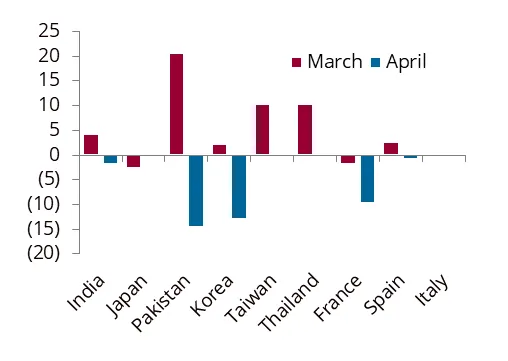
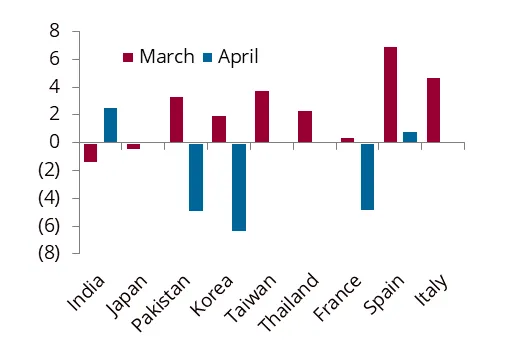
Energy Aspects’ high-frequency indicators, including our proprietary trucking indices and data produced by our colleagues at Kayrros, offer a timely read on how end-user consumption is responding to higher oil prices. One of the most recurring themes in recent discussions with clients has been the status of downstream oil product demand. Physical players all note lacklustre demand in April and May, questioning the health of end-user consumption. These high-frequency indicators have shown little clear evidence of a meaningful reduction in end-user demand. Instead, what physical players are experiencing as poor demand, appears to be destocking by wholesalers in response to extreme backwardation in forward prices.
Trucking activity in the US and Europe remains close to seasonal norms, jet demand outside the Middle East and China has held up well and US gasoline demand shows no clear sign of weakness. Once the rampant destocking in oil product markets in March and April is digested by the system, still-healthy end-user consumption will translate into more demand.
Demand will not remain immune to elevated prices indefinitely and obvious downside risks remain: airlines could further trim schedules and consolidate flights if ticket sales soften, the US is entering the more price-sensitive summer driving season and hauliers cannot absorb elevated prices forever. But without another leg up in prices, any demand decline is likely to be slow and drawn out, risking tighter product balances. High-frequency data will therefore be critical in identifying turning points in downstream consumption over the coming months.
Fig 1: Diesel demand actuals relative to pre-war forecast, %
Source: Energy Aspects
Fig 2: Gasoline demand actuals relative to pre-war forecast, %
Source: Energy Aspects
US gasoline demand unmoved by price; summer driving season key test
Kayrros high-frequency gasoline consumption estimates, derived from connected vehicle data, suggest the US demand response to higher prices has so far been limited, pointing to upside risk to our current forecast. By contrast, some recent institutional research suggests US gasoline consumption fell by as much as 3% y/y in March, based on credit card spending at petrol stations or broader consumer expenditure data. While few in the market take those estimates as accurate estimates of volumes demanded, they highlight how noisy spending-based demand measures are and how misleading their signals can be around turning points.
Spending data are reported in US dollars and must be deflated by retail fuel prices or gasoline consumer prices indices to infer volumes. On that basis, the implied drop appears sharp, but we do not see the same signal in petrol station transaction counts, which have remained firm. We expect this is in part due to a shift in consumption patterns. When prices spike, consumers search actively for cheaper fuel, shifting purchases towards lower-priced petrol stations and lower-grade fuels. Aggregate retail price statistics do not fully capture that behaviour, which can overstate retail price figures and exaggerate the appearance of falling demand when deflating spending data. Historically, spending data have been noisy demand indicators.
We place greater weight on indicators measured in volumetric terms like Kayrros gasoline consumption estimates, which are less volatile and have tracked monthly demand data more closely. This series will be key to tracking US gasoline demand through the summer driving season, when most discretionary driving occurs.
Fig 3: High-frequency US gasoline demand, mb/d, seven-day moving average
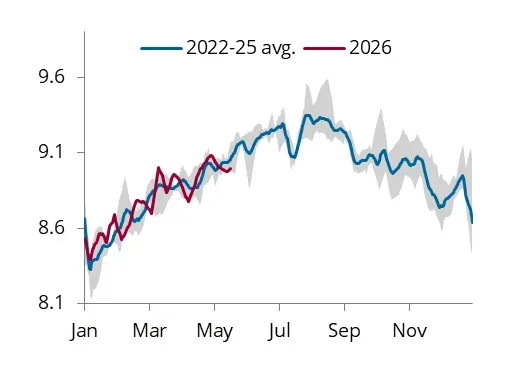
Notes: Simple average of EIA weekly, Kayrros on-road demand and credit card transactions at petrol stations; high-frequency data are normalised to have the same mean and standard deviation as diesel demand from 2023 and 2025 to convert values to mb/d
Source: Kayrros, EIA, CEIC, Energy Aspects
Fig 4: US trucking activity, Index 2019=100
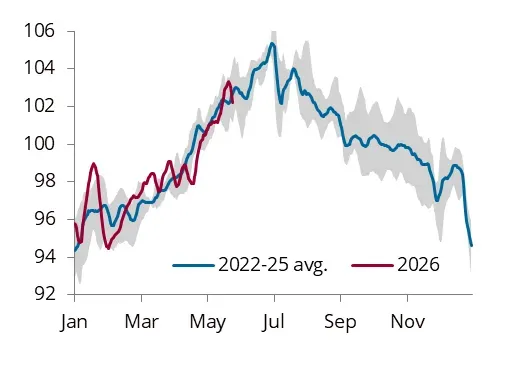
Notes: Combines proprietary EA trucking indices and Kayrros on-road diesel demand
Source: Kayrros, Energy Aspects
Find out how our data and analysis help you track gasoline and jet demand ahead of the market.
US road freight finds limited competition from rail; Europe trucking remains firm
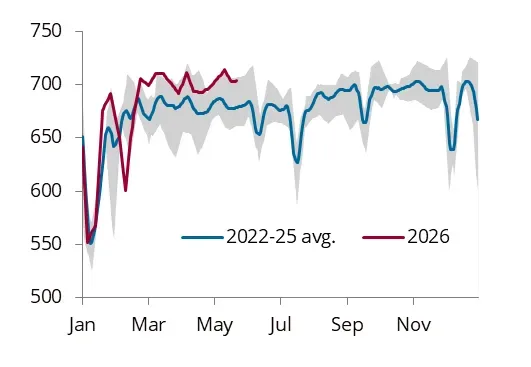
In the US, high-frequency indicators do not point to any broad-based collapse in diesel demand, though both the EA truck indices and Kayrros on-road diesel demand indices softened in late April. A composite road freight index, combining both series, shows this pattern but has recovered towards its seasonal norm in May. That weakness is consistent with rail carload data, which suggest loadings sit at the top end of their seasonal range, as well as reports of some intermodal substitution amid soaring road freight rates.
There is hence some modest downside risk to US diesel demand in April, consistent with our forecast for petroleum diesel demand to remain broadly flat y/y over the period. But it does not signal any marked capitulation in underlying demand. Rail carloads of petroleum products and chemicals have moved above seasonal norms since the war’s start, adding to the evidence of destocking amid elevated product spreads.
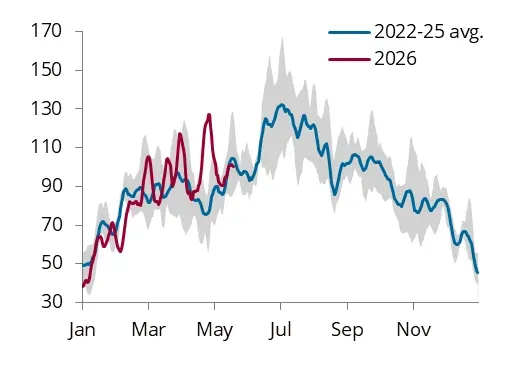
Our proprietary satellite-based trucking indices show no evidence of a slowdown in European road freight, suggesting that price reaction to date has been limited with trucking activity above seasonal norms for much of the year. This strength is broad-based across the region with few signs of weakness, even in countries that have not introduced any major diesel price subsidies, such as the UK. Any limited demand downside is likely led by private consumers and households through less discretionary driving and deferred heating oil purchases in anticipation of lower prices later in the year.
Fig 5: US rail car loads, all goods, ‘000s
Source: Energy Aspects
Fig 6: EU-5 trucking activity, Index 2019=100
Source: Energy Aspects
Get industry-leading intelligence on truck traffic and road diesel demand.
Middle East trucking recovering in May as goods trucked to non-Hormuz ports
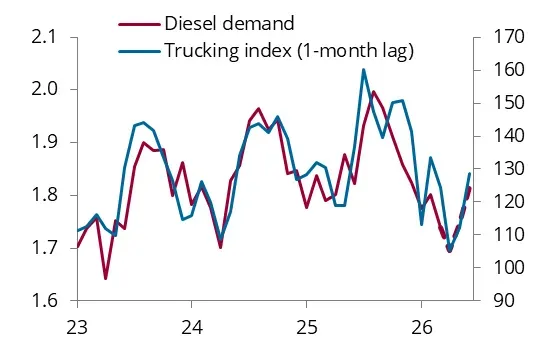
Our Middle East regional aggregate trucking index leads diesel demand by around a month, providing an advanced signal on the direction of demand. The index largely supports our forecast of a diesel demand recovery to around seasonal norms by June. But activity has diverged sharply across the region, reflecting uneven exposure to geopolitical tensions, trade disruption and shifting supply chains. Markets benefiting from overland trade rerouting and stronger domestic logistics have outperformed, while those more exposed to regional disruption remain under pressure.
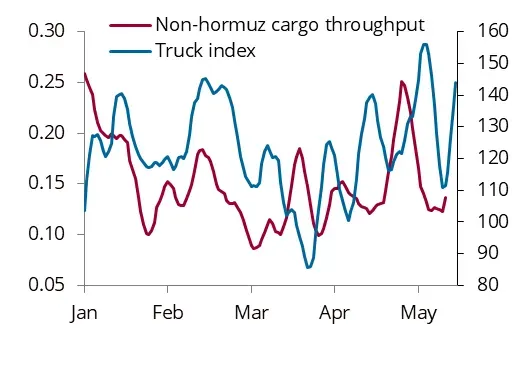
Saudi cargo-port throughput data show that while waterborne departures via the Strait of Hormuz have dried up, those via the Red Sea recovered to around 30% above levels seen in March. Our trucking indices show a similar pattern, rising by around 25% from those levels in March in the month to date, supporting the idea that goods are being shipped across the Kingdom to the Red Sea and propping up diesel demand. Meanwhile, truck activity in the UAE (-17% y/y) and Qatar (-24% y/y) remains under pressure amid weaker regional trade and slower transshipments.
Fig 7: Middle East diesel demand and truck index, mb/d; Index 2019=100 (RHS)
Source: Energy Aspects
Fig 8: Saudi Arabia non-Hormuz cargo throughput and truck index, Mt/d; Index 2019 = 100 (RHS)
Source: Energy Aspects
Global jet demand remains resilient, with Middle East activity recovering
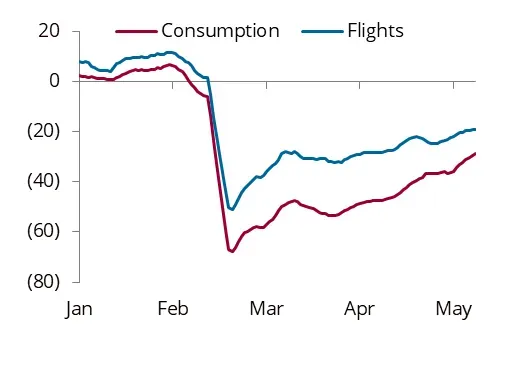
Middle East high-frequency jet demand indicators deteriorated sharply after the US/Israel–Iran conflict began on 28 February. Radarbox data show commercial flights collapsing in March before gradually recovering through April and May, though activity remains well below pre-conflict levels. Kayrros jet consumption data show a smaller decline with lower fuel-per-flight intraregional travel hit hardest.
We expect Middle East jet demand to recover gradually through August, with y/y declines narrowing from around -0.37 mb/d in March to near-flat levels by late Q3 26 as regional aviation activity normalises. But there is downside risk to this forecast as the pace of recovery will partially depend on how swiftly non-Middle Eastern carriers regain confidence in the region as a hub between East and West.
Fig 9: Middle East jet fuel consumption and flight activity, % y/y
Source: Kayrros, Radarbox, Energy Aspects
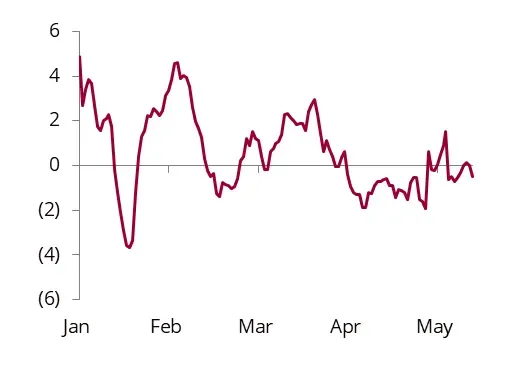
Fig 10: Global (ex-Middle East and China) flight activity, % y/y
Source: Radarbox, Energy Aspects
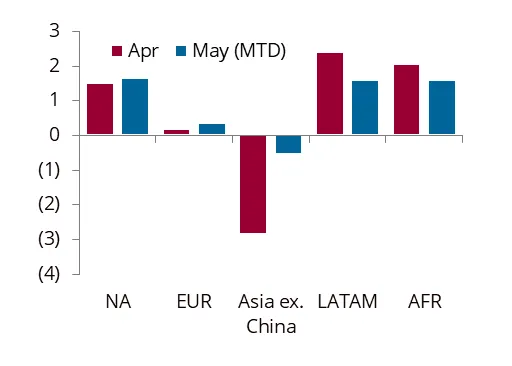
Outside the Middle East, high-frequency indicators suggest global aviation activity has remained comparatively resilient. Flight counts, excluding the Middle East and China, have tracked near the lower end of their historical range since the start of the conflict, with weakness concentrated in parts of Southeast Asia exposed to disrupted transit routes and temporary jet fuel shortages, notably Thailand, the Philippines and Singapore. Europe and North America have been less affected, and we continue to expect jet demand growth outside the Middle East and China to strengthen to around 2% y/y through H2 26.
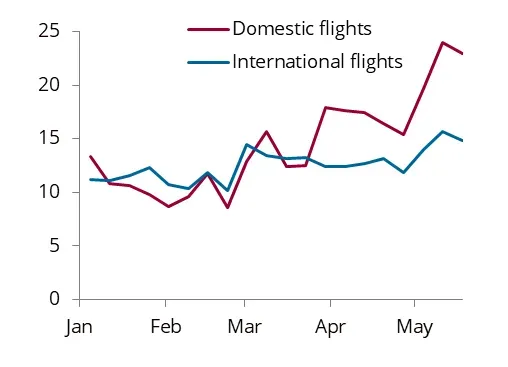
In China, jet fuel demand was 0.75 mb/d in April, down by 0.30 mb/d m/m on rising domestic flight cancellations, with risks skewed to the downside for our forecast over bal-year. High-speed rail poses a growing threat to jet demand, as highlighted by Labour Day travel data. High-speed trains, which can reach speeds of 350 km/h on major routes, are eating into demand for short-haul flights. High-frequency data show the cancellation rate of domestic flights has climbed from roughly 10% in January–February to more than 17% in March–May.
Fig 11: Commercial flights growth per region, % y/y
Source: Kayrros, Radarbox, Energy Aspects
Fig 12: Chinese passenger flight cancellation, %
Source: Radarbox, Energy Aspects
Find out how our high-frequency oil demand indicators help you track real-time consumption trends.
Recent Posts