

Quant Analytics: Where positioning insight drives better decisions
Turn market complexity into a consistent investment edge with data-driven energy intelligence
Why oil benchmark prices don’t reflect the real cost of crude
The physical market is telling a very different story to the futures screen. Here is what is driving the disconnect — and why it matters for energy market participants.
The Strait of Hormuz crisis has produced one of the widest divergences between physical and paper crude oil prices in recent history. Benchmark futures suggest a market that is tight but manageable. The physical market tells a different story entirely.
Understanding why these two price signals have decoupled — and which one is more reliable — is critical for anyone making trading, hedging, or investment decisions in the current environment.
What the oil benchmarks say versus what cargoes cost
At the time of writing, Brent crude futures are trading in the mid-$90s per barrel. That is elevated by recent historical standards, but it is not pricing a crisis. It does not signal the kind of acute supply disruption that the physical market is experiencing.
The physical market paints a starkly different picture. Dated Brent has surged well above $140/bbl. Dubai, the key Asian benchmark, spiked to $170/bbl before contract changes reduced the number of deliverable cargoes. West African and North Sea cargo prices are trading at substantial premiums to benchmarks. And once freight costs are factored in, crude is landing in Asia at well over $170/bbl.
These are not marginal differences. The gap between the screen price and the actual cost of procuring and delivering a cargo of crude has widened to levels that are distorting refining economics, hedging strategies and procurement decisions across the globe.
Why oil futures are lagging the physical reality
As EA’s Quant team has been highlighting to clients, several structural factors are suppressing the paper price relative to the physical market.
Liquidity & Risk Capacity
The first is liquidity and risk capacity. Open interest and trading volumes have fallen sharply since the conflict escalated. Exchanges have raised margin requirements, and elevated realised volatility has sharply restricted VaR — the risk budget under which systematic and vol-sensitive funds operate — forcing them to cut positions regardless of fundamental view. The result is a thinner market, less responsive to fundamental signals, in which price discovery is being actively suppressed — not because participants disagree with the tightness thesis, but because they cannot carry the positions that would reflect it.
Hedging Dislocation
The second is the hedging dislocation. Many physical market participants had hedged Middle Eastern cargoes that never materialised. That has left them with short futures positions exposed against physical obligations that have shifted to higher-cost Atlantic basin supply. Unwinding those positions in a low-liquidity environment is difficult and slow.
Timing
The third factor is timing. The most acute tightness is concentrated in the prompt physical market — March and April loadings — while futures trade two months forward. That structural lag means futures are pricing a period when the market expects some recovery in Hormuz flows, even though the current physical shortfall is severe.
Asia is buying crude, but the West has not felt the full impact yet
Asian buyers, facing the most direct exposure to the loss of Middle Eastern supply, have moved aggressively into the Atlantic basin. US crude exports have surged to record levels, running more than 1 mb/d above normal. That buying spree has pulled available supply away from European and US refiners, who typically purchase on shorter lead times.
The procurement cycle difference is significant. Asian buyers commit two months in advance. European buyers operate one month ahead. US refiners often purchase weeks or even days before delivery, relying on pipeline supply. In a scramble for barrels, Asia’s longer lead time has given it a structural advantage — and left Western buyers increasingly exposed to a tightening prompt market.
The implication is that the price impact in the West is delayed, not absent. As US refiners begin competing for a diminished pool of available crude in the May and June trade cycles, the physical price pressure that Asia has already absorbed will begin to materialise in Western benchmarks.
USGC implied fixtures to Asia, mb
Source: OilX, Energy Aspects
Refining margins are the transmission mechanism
The disconnect between physical crude prices and benchmark product prices pushed refining margins deeply negative in several regions. European margins weakened heavily month on month for the May planning cycle. Asian refiners are running for security of supply rather than margin, but even that approach has limits.
This is the mechanism through which the physical-paper gap eventually closes. Crude prices at current benchmark levels cannot sustain refinery operations when physical input costs are $40–50/bbl higher than the screen suggests. Either product prices must rise to restore margins, or crude benchmarks must fall to reflect the margin destruction — or, most likely, a combination of both, with products doing the next leg of the work. already absorbed will begin to materialise in Western benchmarks.
Why convergence is coming — but not overnight
The physical and paper markets will converge. They always do. But the path and timing depend on several variables that remain uncertain: the pace of Hormuz transit recovery, the duration of Strategic Petroleum Reserve releases that are currently masking the tightness, and whether product prices rise fast enough to restore refining incentives before stocks reach critically low levels.
What is clear is that benchmark crude prices alone are an insufficient guide to the actual state of oil market fundamentals. Participants relying solely on the futures screen risk underestimating the severity of the current disruption — and the scale of the price adjustment that may still be ahead.
Henry Hub: Positioning Signals Ahead of the Flow-Driven January Squeeze
Energy Aspects Quant Gas research identified mechanical upside risk before the largest rally since 2022
In early January, Henry Hub positioning was structurally short.
Since 2025 year-end, approximately 90,000 lots of fresh open interest had been added. CTAs were positioned at roughly 100% of their maximum short capacity. Discretionary short positions had clustered between $3.40 and $3.80/MMBtu. And traders had accumulated around 35,000 lots of February $5/MMBtu calls, creating significant negative dealer gamma pocket at that strike.
The market was heavily one-sided and mechanically fragile.
Beginning 8 January, Energy Aspects Quant Gas research highlighted asymmetric upside financial flow risk, identifying the structural vulnerability before the rally unfolded.
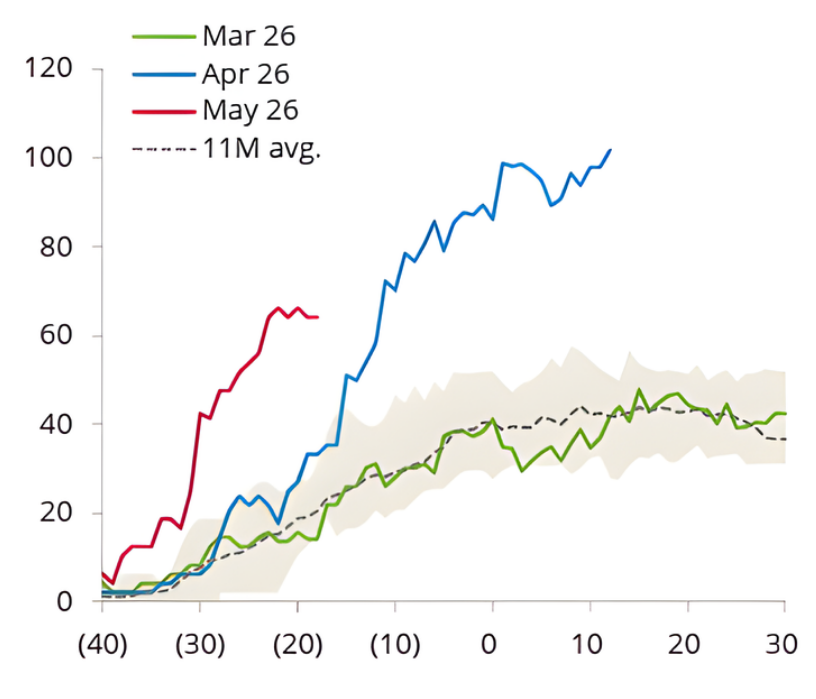
An upward HDD revision acted as a key trigger, lifting prices at the week’s open and forcing traders to cover shorts in a rush during the US morning despite the MLK holiday. Continued short covering, alongside CTA buying flow, further fuelled the rally. Within a few sessions, the prompt Henry Hub contract surged from $3.40 at the week’s open to over $5/MMBtu, reaching its highest level since 2022.
This was not just a fundamental repricing; it was amplified by financial flows.
The timeline below reflects research notes and positioning alerts delivered to Quant Gas clients as the setup developed and the move unfolded.
Research and Alerts provided to Quant Gas clients
8 January
Upside flow risk identified ~40k fresh shorts added in five sessions. CTAs near maximum short. $5 negative gamma pocket building. Structural squeeze risk explicitly flagged.
9–12 January
Positioning becomes extreme 90k+ lots of OI added since 31 December. Short clusters align with CTA flip levels. Reversal risk elevated if catalyst emerged.
19 January, 7am EST
Reversal flagged HDD forecasts revised colder over the weekend. ~20k lots of CTA buying triggered at the open. Shorts in the $3.40–3.60 range immediately pressured. Mechanical squeeze underway.
Week of 19 January
Flow-driven rally accelerates 65k+ lots of short covering. Dealer short gamma amplified volatility into strength. Price reached highest level since 2022.
22 January
Exhaustion identified Prompt shorts largely cleared. CTA support beginning to fade. Reversal risk assessed as less violent than the rally itself.
Why the move extended
Three reinforcing financial flow dynamics operated simultaneously:
01
Short covering
Clustered discretionary shorts were forced to exit as price breached entry levels.
02
CTA buying
Systematic trend models flipped long as thresholds were triggered, adding mechanical demand.
03
Dealer hedging
Negative gamma exposure, particularly into the $5 strike, required dealers to buy into strength, amplifying intraday moves.
The weather revision catalyst was incremental. The positioning was structural.
The Quant Gas edge
Henry Hub is increasingly flow-driven at inflection points.
The Quant Gas service integrates systematic CTA modelling, real-time open interest classification, dealer gamma exposure mapping, and weather and physical market context to identify market positioning risks.
Understanding situations where systematic triggers sit, where entry positions are concentrated, and when covering pressure is exhausted materially can make a difference to entry timing, sizing, and risk management.
Full January positioning research, including original timestamped notes available below:
8th of January - Quant Weekly
Upside-skewed financial flow risk building in Henry Hub
Henry Hub CME prompt curve recently experienced a significant increase in fresh shorts (~40k lots in the last five sessions), with our classifier indicating most were added around $3.60 and $3.80/MMBtu. These positions were established after the last CFTC data point (post-30 December).
These short entry levels align with some CTA buying thresholds. If breached, short-covering could trigger further trend-following buying flow, increasing the potential for price rally. At the same time, option dealers are set to provide only minor resistance to price moves around current levels, with their hedging flow becoming neutral as prices rise.
Aligning with this upside risk, option traders have recently shown appetite for deep out-of-the-money calls on the prompt tenor, particularly at the $5/MMBtu strike, making dealers’ gamma exposure pronouncedly negative at that level and setting the stage for increased volatility if prices reach it.
Price level of CTA flow to trade and all participant short entry points, $/MMBtu
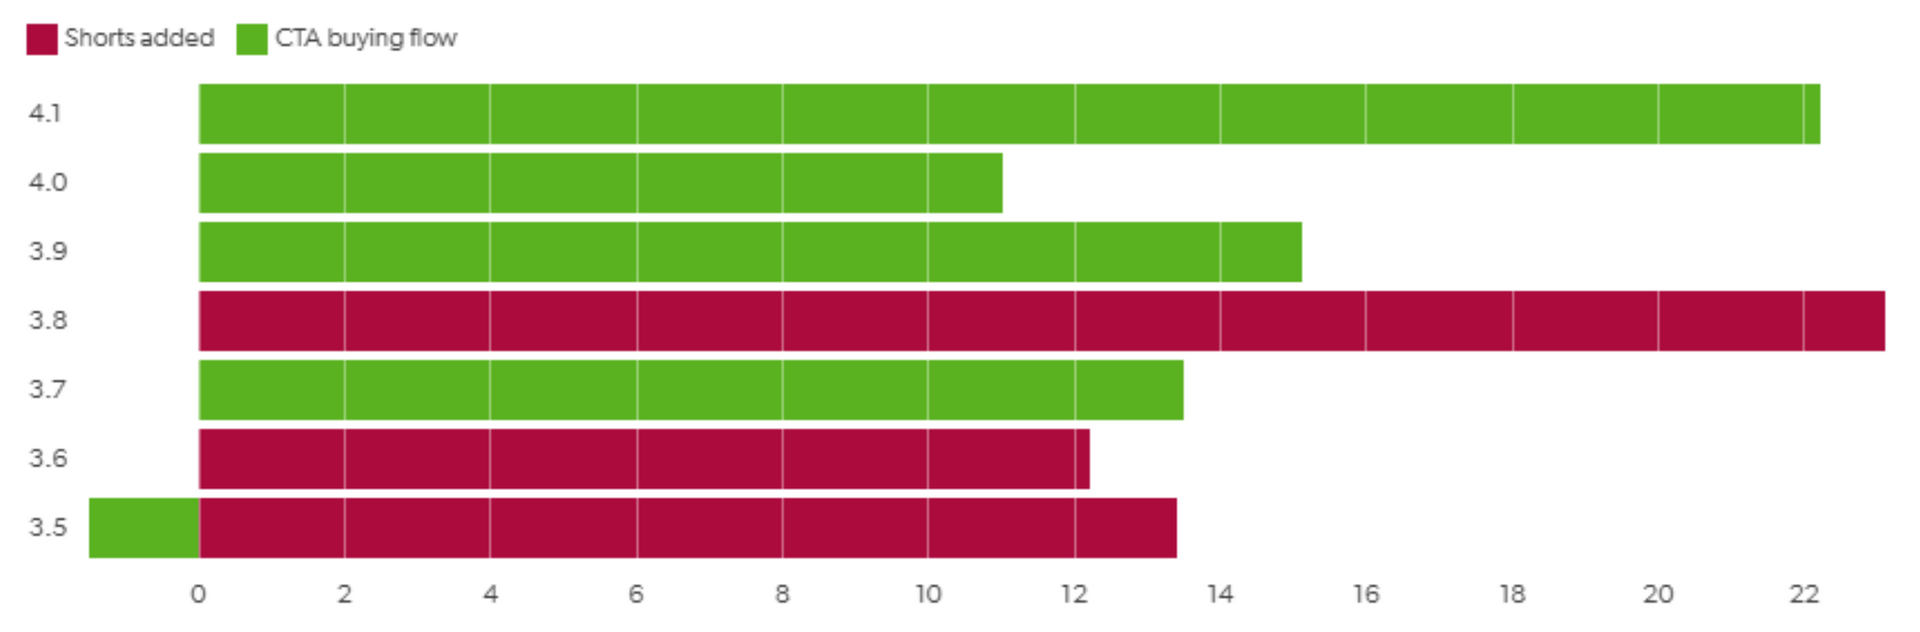
Source: Energy Aspects
9th of January – EA Live post
Continued short-driven OI build in HH + deep OTM 26 February $5 calls bought + CTAs near max-short
Prompt Henry Hub OI classification, k lots
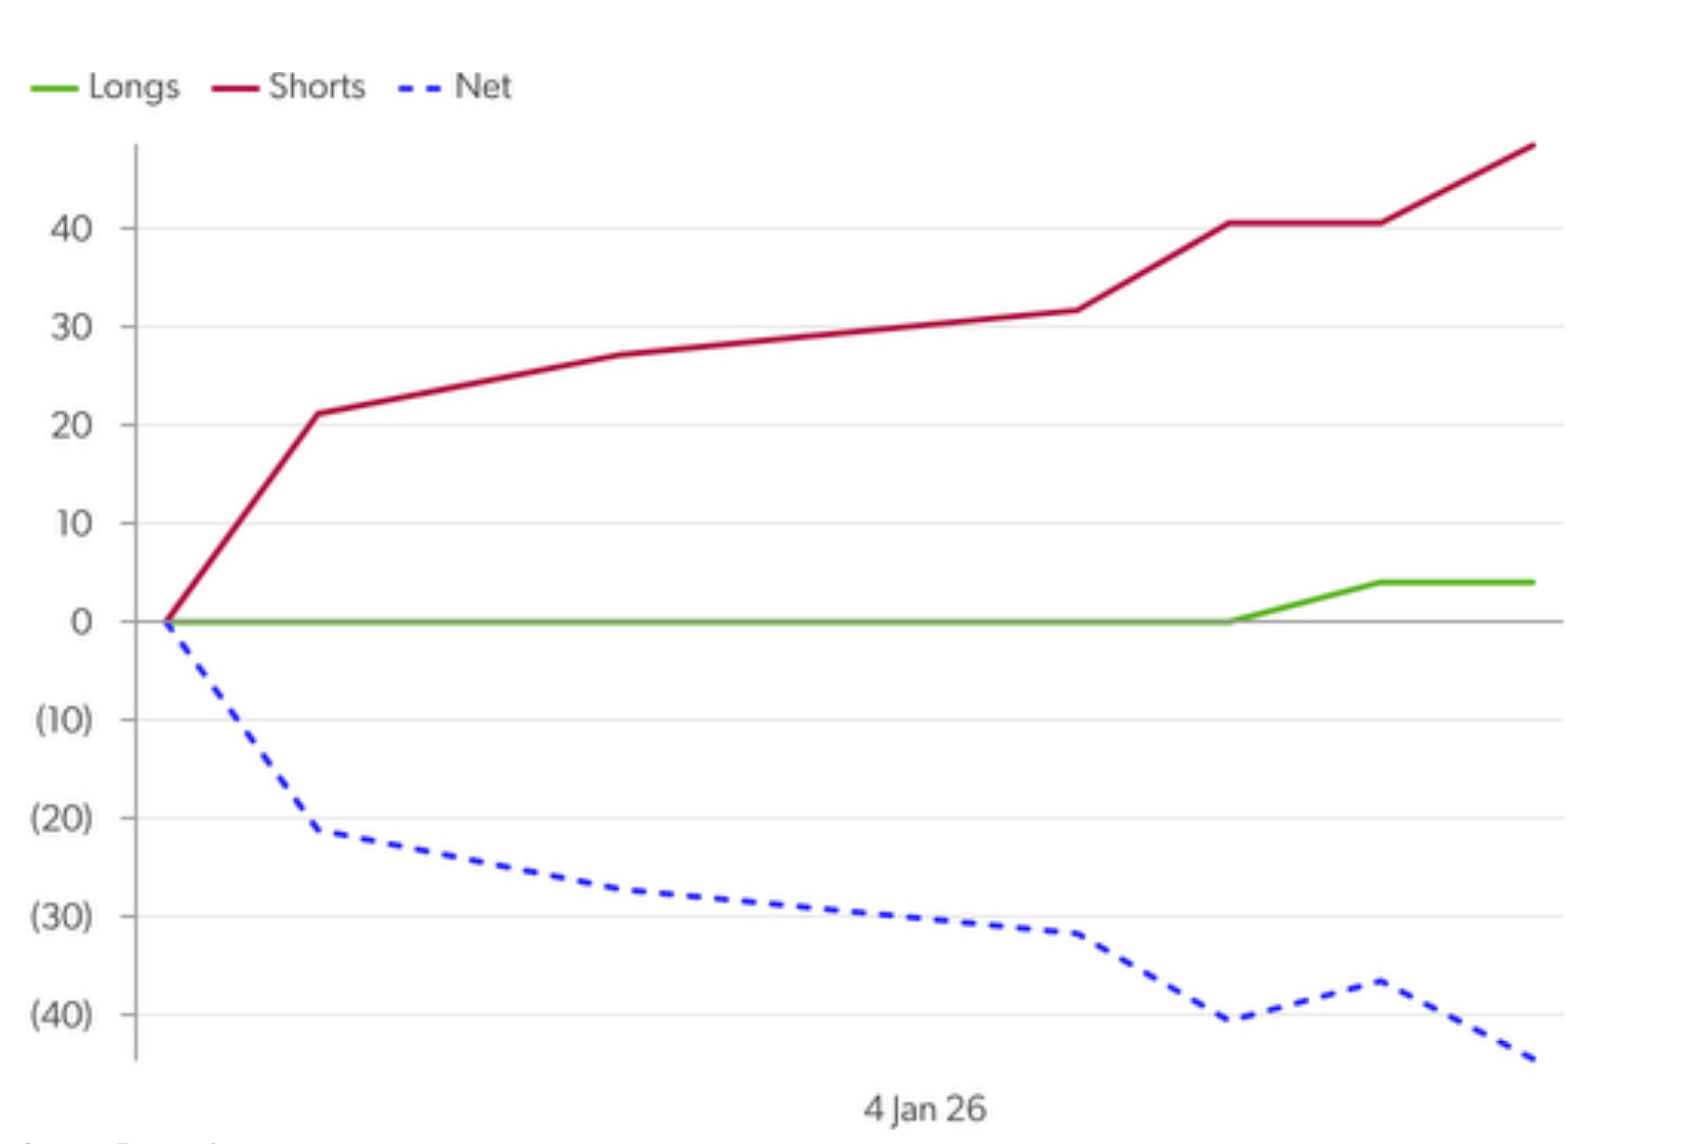
Source: Energy Aspects
Henry Hub dropped d/d after yesterday’s EIA storage report, with fresh shorts added across the curve (around 8k in the prompt curve alone). Recent position inflows have driven a significant increase in aggregate open interest, with around 93k lots added since 31 December.
CTAs represent a key risk under current conditions, now sitting at over 90% of their maximum-short positioning. Key levels to flip long align with recent short entry points, increasing the potential for a reversal if a catalyst emerges.
In contrast to the recent build-up of long prompt calls at $5.00/MMBtu (roughly 35k added w/w, creating a hot negative gamma pocket), option traders added 7.6k 26 February calls d/d, with most of them sold between the $4.00 and $4.50/MMBtu strikes.
12th of January – EA Live post
Reversal risk intensifies in HH
Henry Hub last Friday (9 January) dropped again d/d, with over 50k lots of short-driven OI inflows into the front three contracts, mostly around $3.35/MMBtu (prompt price), with a large concentration in 26 March. Our position crowdedness indicator has risen sharply in recent sessions, with CTAs now about 100% maximum-short.
Alongside the notable amount of recently added shorts that risk being covered if fundamentals turn more bullish—with the latest weather forecasts adding some HDDs for the second half of the month—these factors increase the risk of an upward price swing in both outright prices and prompt timespreads.
Option traders partially mitigated this risk with long call trades d/d, with significant activity in 26 March around the $3.00/MMBtu strike. Most of the outstanding prompt risk remains on 26 February $5.00/MMBtu long calls.
Henry Hub front three contracts OI changes, k lots
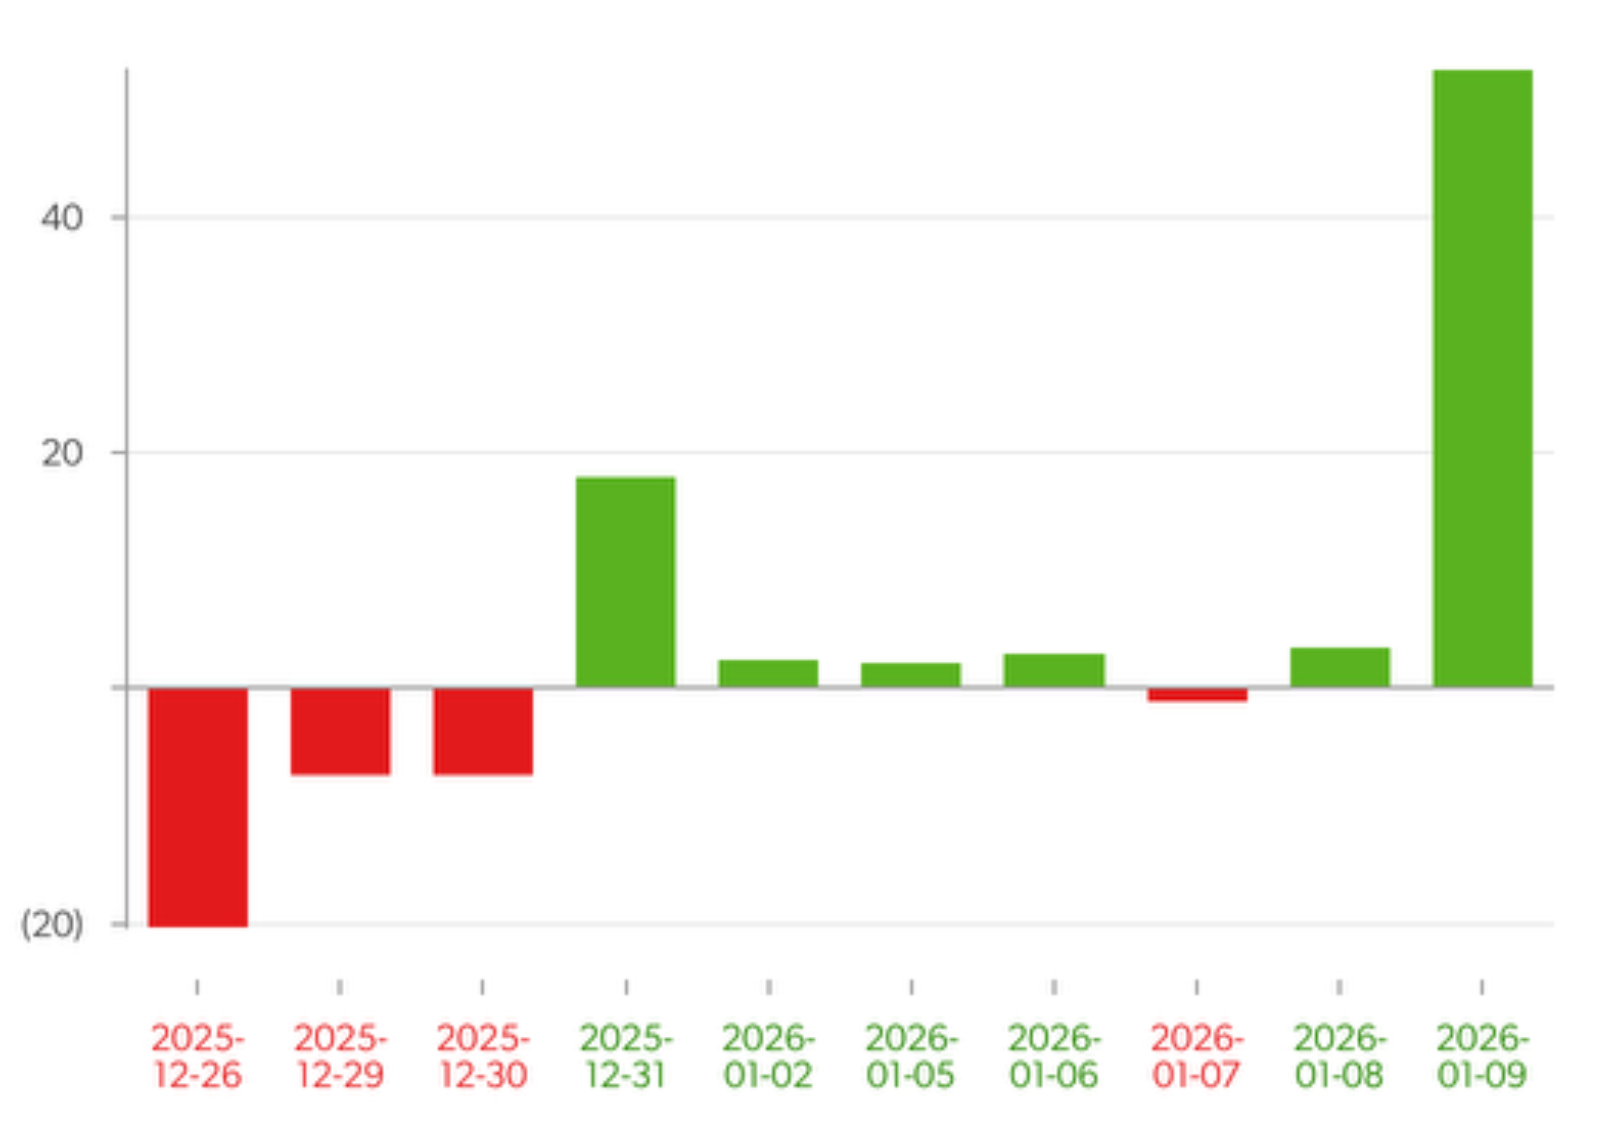
Source: CME, Energy Aspects
19th of January – EA Live post
Henry Hub jumps at week’s open on cold-weather forecasts (catalyst provided), triggering a very upside-skewed financial flow risk.
(Reversal begins! We flagged it at 12 UK time, i.e. 7am EST.)
Henry Hub jumps at open; financial flows set to help the move
Henry Hub jumped at the week’s open as HDD forecasts increased over the weekend.The move triggered nearly 20k lots of CTA buying flow, with trend followers entering the week near 100% maximum short, and put pressure on recently added shorts. These shorts, established after the latest CFTC datapoint (the 7–13 January report showed little w/w change in net positioning), total near 15k lots with entry levels below current prices.
We estimate option dealers’ gamma exposure turned negative after last Friday’s trades —mainly driven by bought calls across the front two tenors—positioning them to amplify price swings, especially above current prices.
Financial flow risk remains upside-skewed, with a key threshold just above current prices as almost 30k previously added shorts in the $3.40–3.60/MMBtu range face short-covering risk. Further key levels are around $3.90–4.00/MMBtu, where about 34k lots of CTA buying flow sit and over 20k previously added shorts could be covered.
Henry Hub price level of CTA flows, $/MMBtu
Source: Energy Aspects
22nd of January – Quant Weekly
Description of what happened; $5 key gamma pocket in that moment.
No sudden reversal expected.
Henry Hub surged as strong upside-skewed financial flow risk set the stage, with cold weather forecasts providing the catalyst.
Previously added shorts were forced to close by the week’s strong open over the US holiday, with over 65k lots of short covering so far this week. This, combined with CTA buying and aggressive option dealer hedging flow, rapidly lifted prompt prices to the highest since 2022. We highlighted these financial flow risks earlier this month.
Trend followers will continue to provide support until next Wednesday (28 January), but short covering is likely exhausted in both outright and in prompt timespreads, as indicated by a flat short position in our prompt OI classifier. With positioning not particularly stretched at present, a subsequent price reversal would likely be less sharp than the move up.
Option dealers remain key players at least until next Tuesday (27 January; 26 February option expiration) with short gamma positions fuelling volatility. We continue to flag a particularly intense short gamma pocket at $5/MMBtu arising from over 36k lots of remaining call OI in 26 February.
Henry Hub: Estimated dealer position around key strikers, k lots
Source: Energy Aspects
The anatomy of a stop out - Discretionary funds in TTF Quant Analytics
Summary
01
Discretionary fund net-long TTF positions peaked at 369k lots on 7 February, declined by 30% after geopolitical developments triggered reductions.
02
Trump–Putin call on 12 February triggered significant financial flow risks, causing drop in TTF prices, increased market volatility.
03
Discretionary hedge funds only reduced net-long positions by 37k lots, despite 9% price drop; positions remained in the money.
04
Drawdown constraints in late February cause position exodus, exacerbating the price decline.
Discretionary fund net-long TTF positioning reached record high of 369k lots on 7 February before experiencing exodus, falling by 30% to 261k lots currently. The build-up of these positions, along with the potential risks of unwinding, is something we have covered in depth in our EA live posts and Gas Quant Weeklies. This insight breaks down all our recent coverage, explaining in detail the financial flow mechanics that have driven TTF prices down by over 30% in the last month.
Market setup
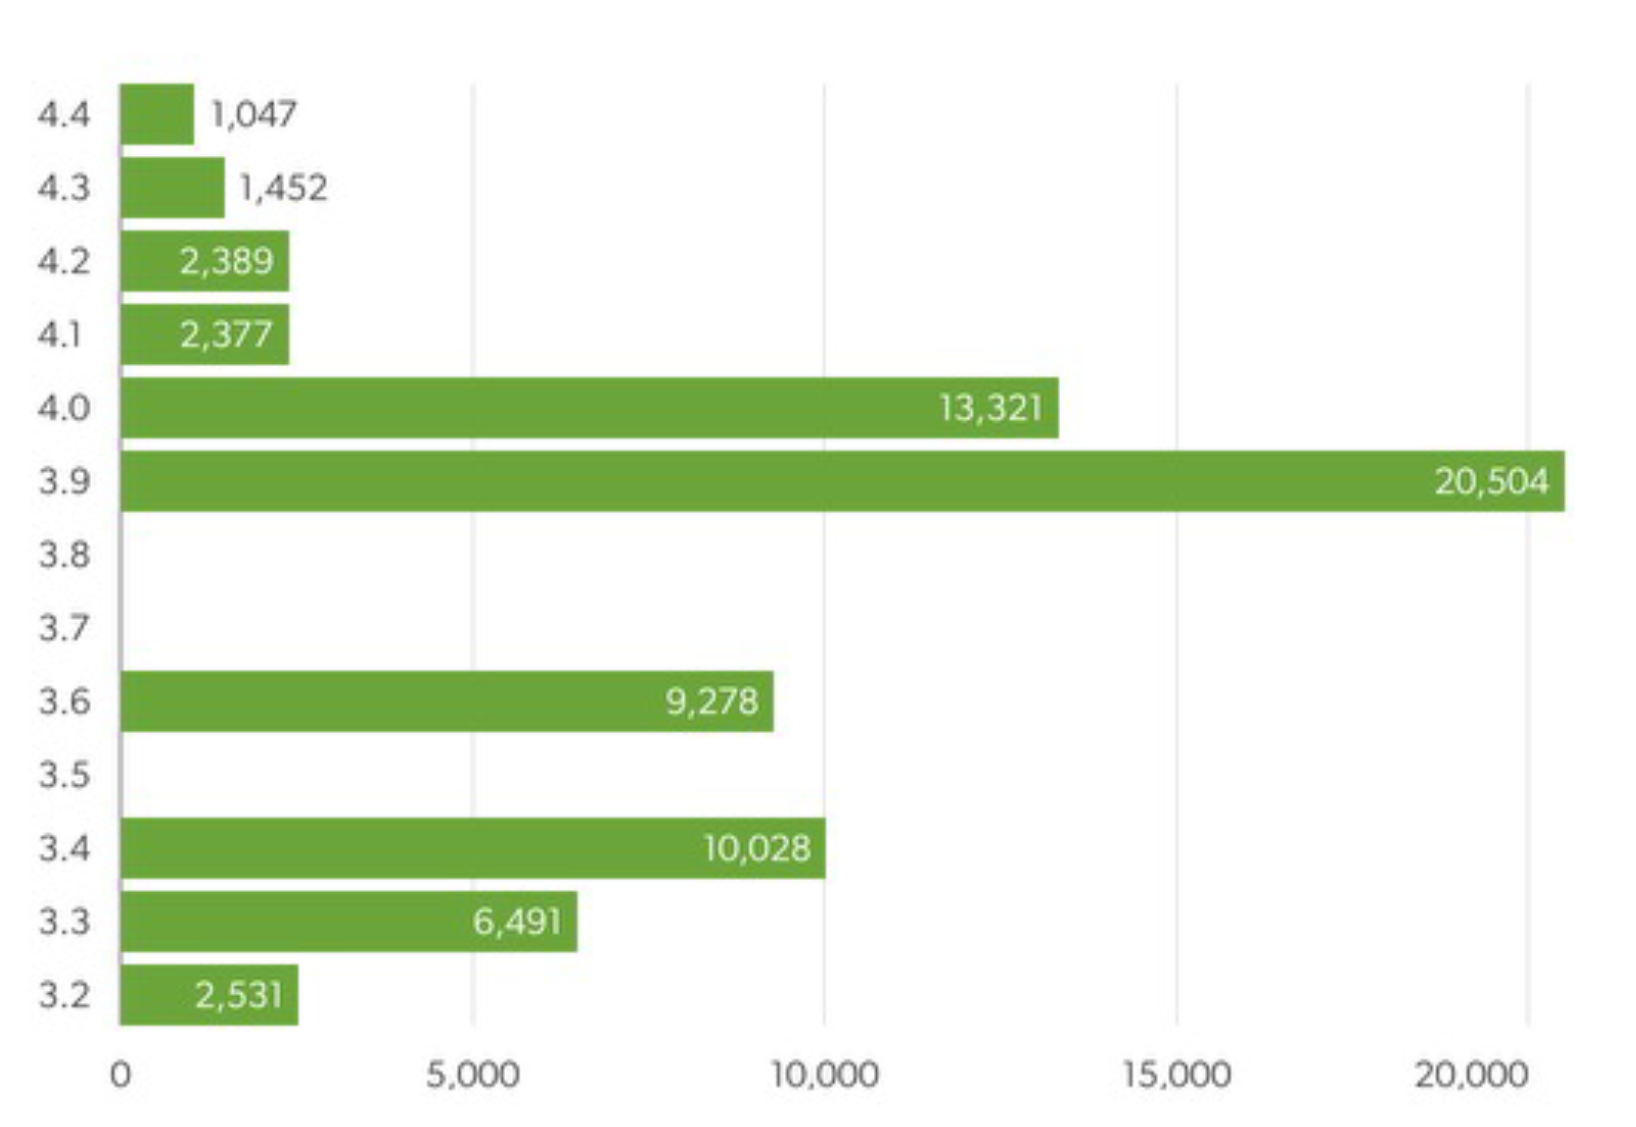
Discretionary funds reinforced their net-long TTF positions from mid-December 2024, with the expectation that Russian gas flows into Ukraine would cease in the new year, which duly materialised. This increase in net-long positions continued until 7 February, at which point they hit an all-time high of 369k lots, with gross notional discretionary Value at Risk (VaR) reaching €0.66bn, the highest level (at the time) since September 2022 (see Figure 1).
Fig 1: Gross notional discretionary hedge fund VaR, €bn
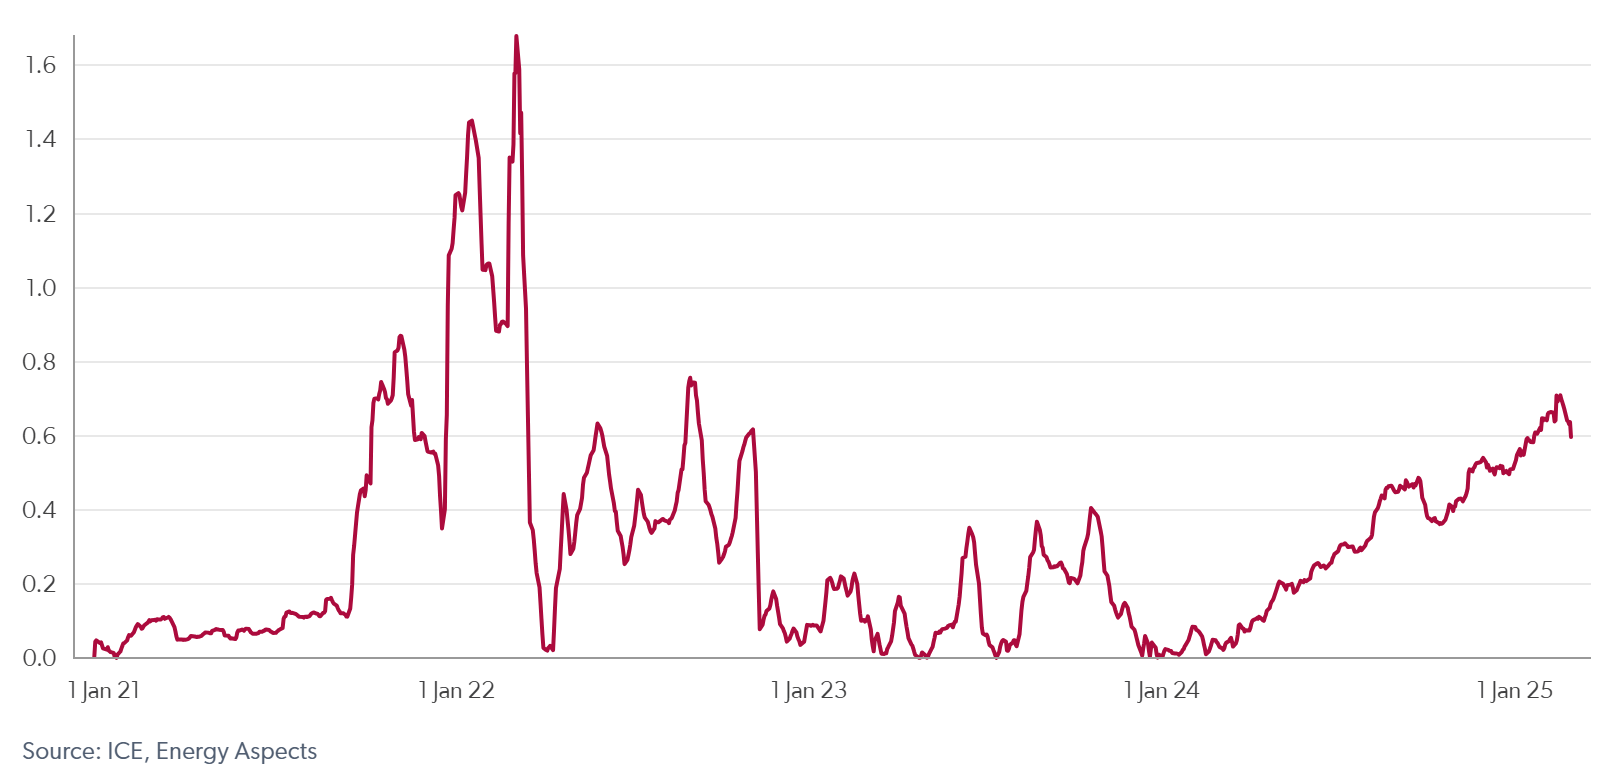
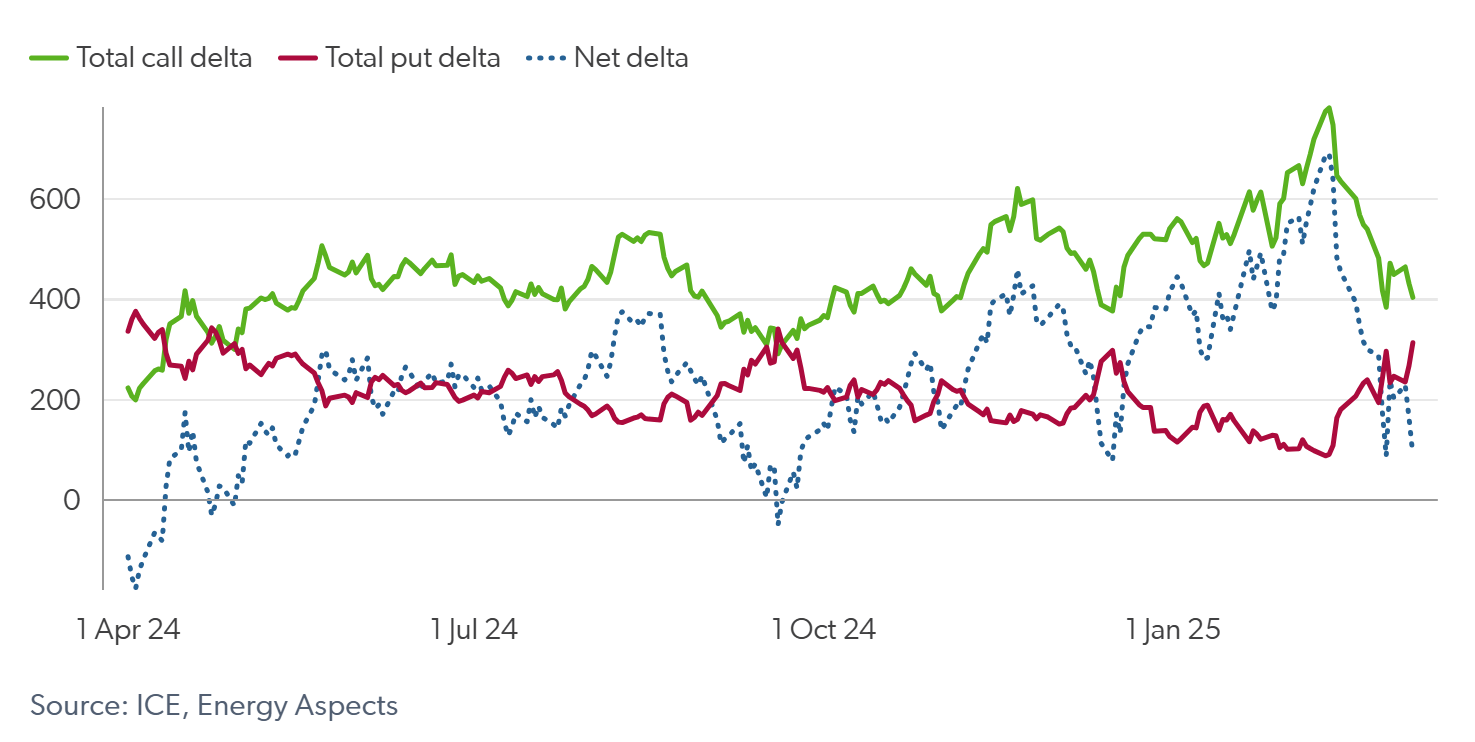
However, the final increases in the net position was largely driven by an increase in options delta as prices rose (see Figure 2), rather than increased futures positioning (the investment fund category, comprising CTAs and discretionary funds in the MiFID Commitment of Traders report, includes both futures and options delta). As such, options dealers supported prices as they hedged their sold calls by buying the underlying futures.
Financial flows were then primed to add to any downside impetus, given how stretched to the long side they had become. CTAs were at maximum-long positioning, with overall positions in crowded territory, which our research shows is often associated with price relief and even reversals. Furthermore, net market option delta hit a high of 690k lots by 11 February, adding the risk of option dealer unwinding to the mix (see Figure 3).
Fig 2: Net total option delta (call–put, scaled) vs discretionary net position (k lots)
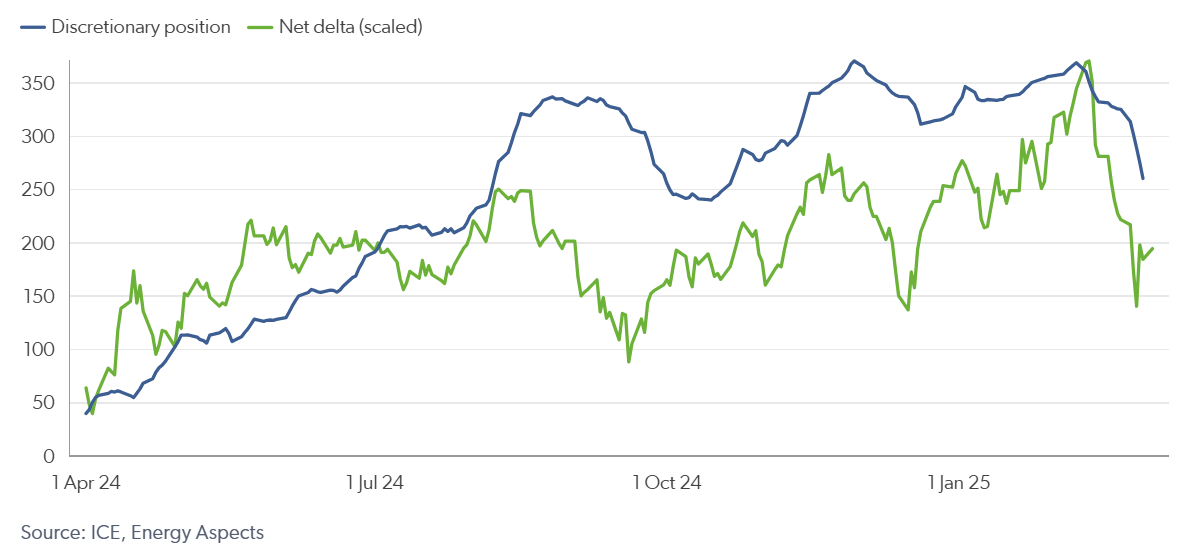
Fig 3: Option market delta, k lots
The catalyst
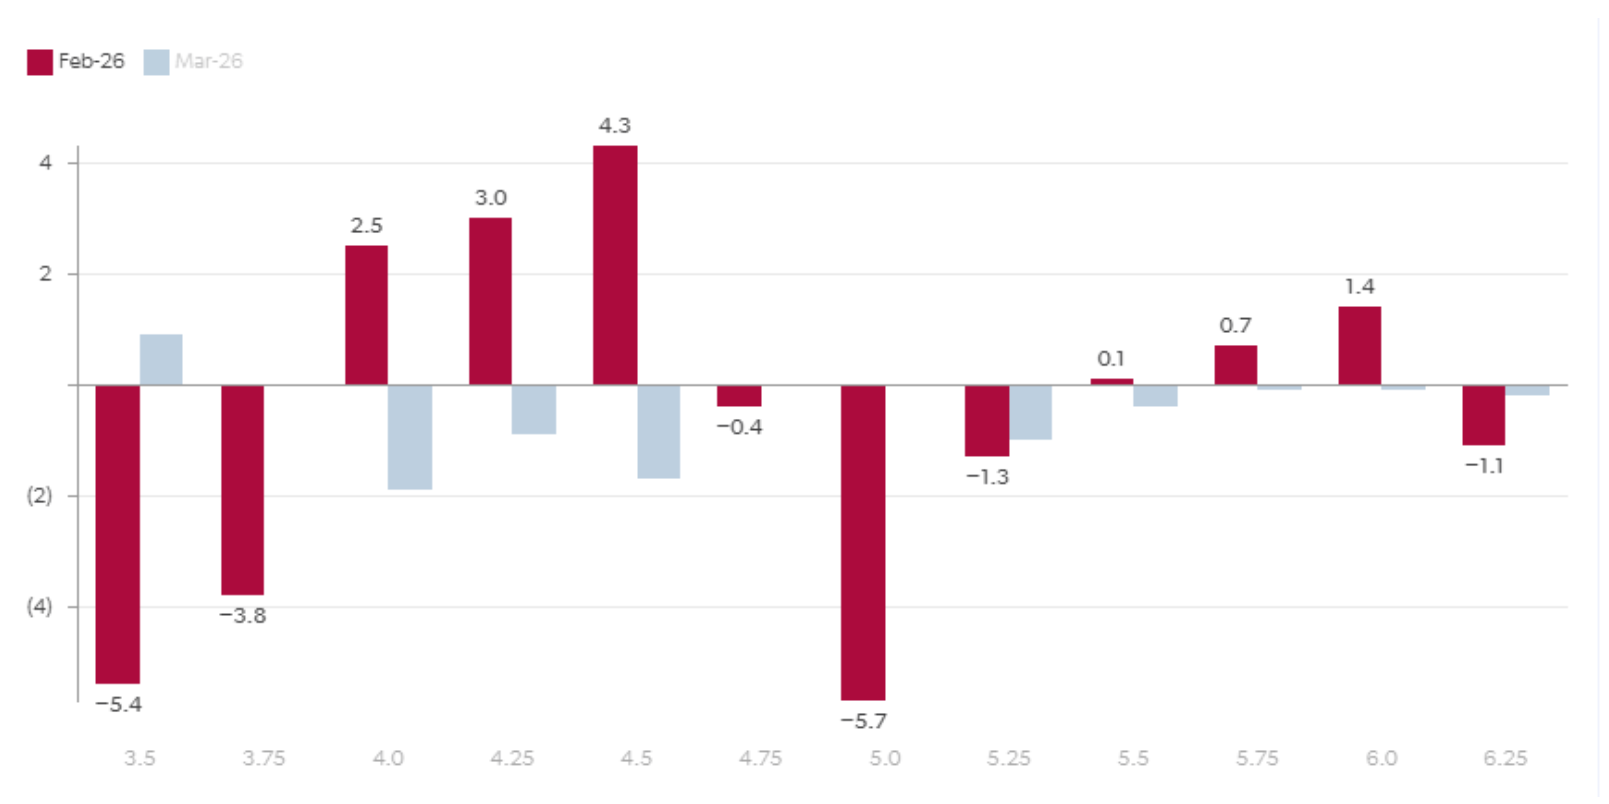
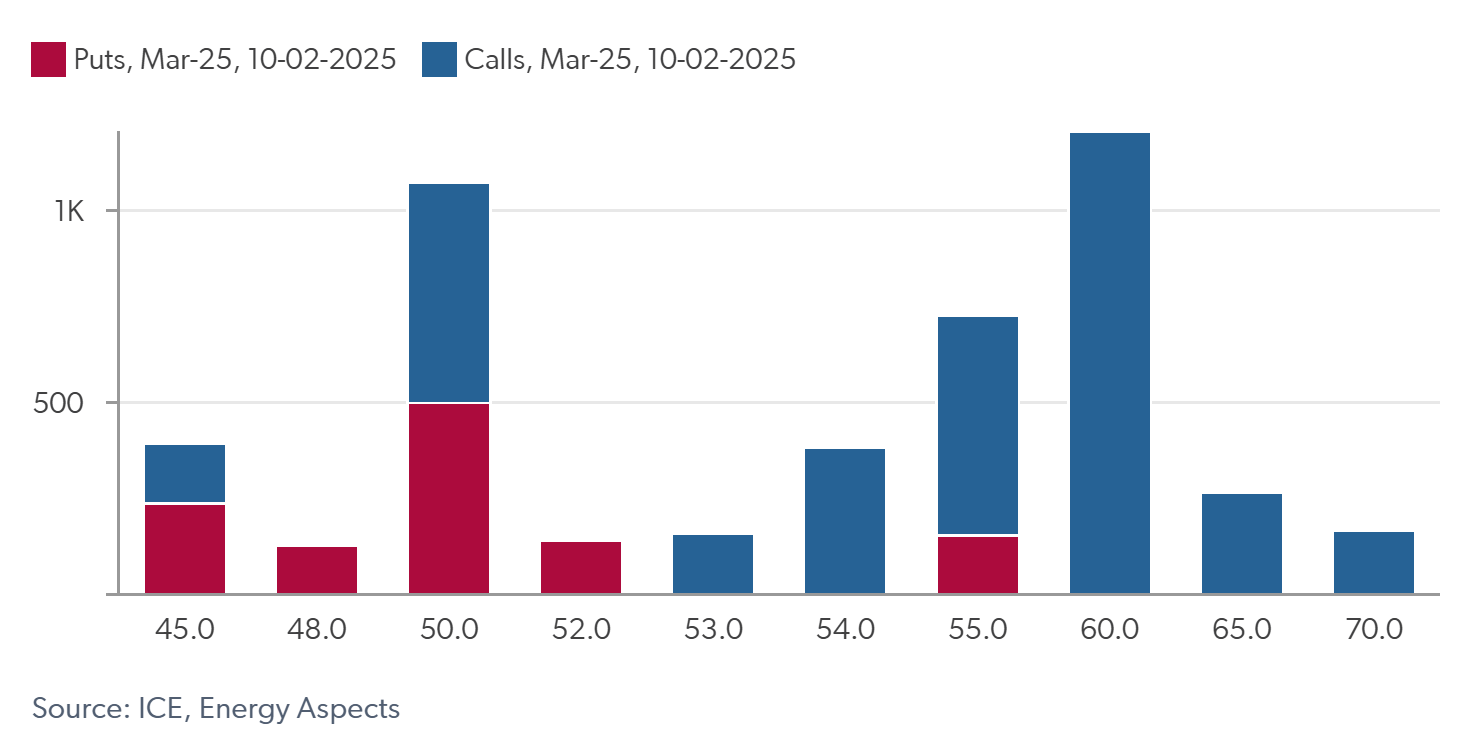
News broke on 12 February (just after the TTF market closed) that US President Donald Trump had called Russian President Vladimir Putin and agreed to instruct their teams to “start negotiations immediately”. Soon after this, we released an EA live post titled “Net-long TTF speculative positions at risk after Trump–Putin call on Ukraine”. Here we flagged several financial flow risks that would add to downside caused by the news. First, we highlighted the 44k lots of long-driven open interest recently added onto the Sum-25 contract, with VWAP levels between €51.50/MWh and €54.75/MWh (see Figure 4). These price levels posed key-risk levels, as the traders would likely be forced to close these positions as they start drawing down. Additionally, we noted that a large price drop on the market open would result in significant selling from option dealers, particularly around large gamma concentrations through €55/MWh and €50/MWh (see Figure 5), as they reduce their long delta hedges. Finally, we added that CTA selling would pick up if prices moved through the same level, adding further downside risk.
TTF prices dropped by over €4/MWh on 13 February, crossing through many of the key-risk levels we flagged the evening before. Many of the recent Sum-25 longs that we flagged to be at risk were closed out, as reflected in OI decreases and weakening of the Sum-25–Win-25 spread. In our Gas Quant Weekly on that day, we highlighted that further downside was likely given the continued risks. For instance, we flagged that if prices continue to drop, we would expect to see significant selling from option dealers, as their option hedging activity is symmetric. In particular, if prices dropped through €50/MWh, at which 23k (20k) lots of calls (puts) sat in the front month (Mar-25). Furthermore, we flagged large CTA selling levels at €50.50/MWh and €49.50/MWh. We also stressed that prices were already weakening before the news due to factors such as what might be the last cold spell of winter, large volumes of LNG set to arrive in Europe and over-positioning for Sum-25 delivery.
Fig 4: Outright Sum-25 price level €/MWh of open interest changes, k lots
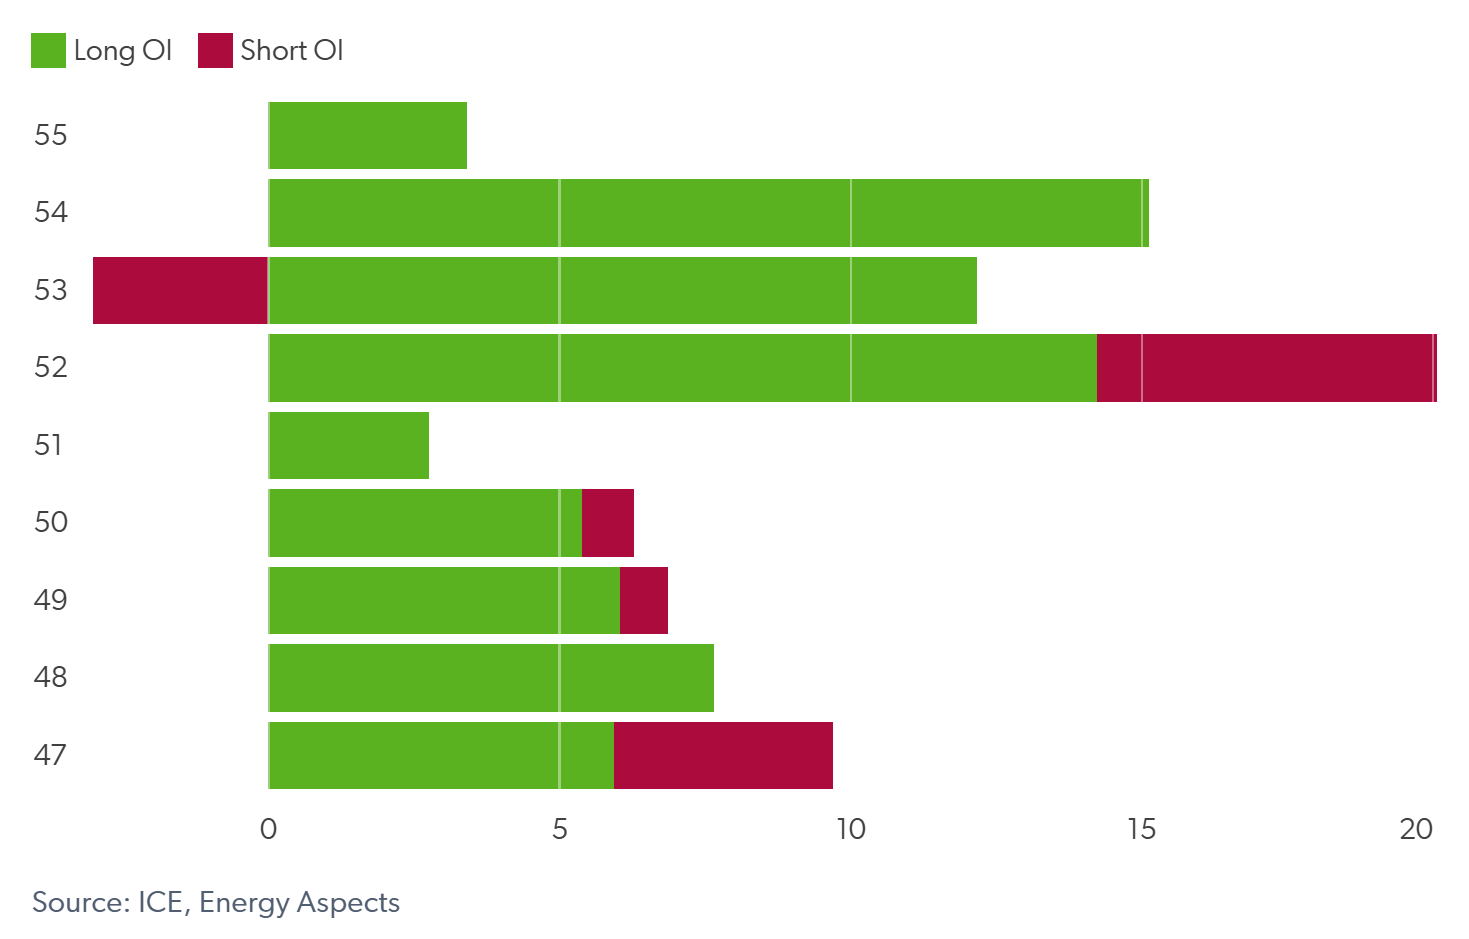
Fig 5: Gamma concentration levels, front month
Sticky longs
Despite prices dropping by 9% in the front from 7–14 February, discretionary hedge funds cut just 37k lots (10%) from their net-long position. This was less than we expected, particularly when factoring in that a large part of this cut was a result of a decrease in options delta. In the following Gas Quant Weekly, published on 20 February, we outlined several reasons for this. One was that some funds were clearly buying the dip with strong resistance points at €54/MWh, adding new longs. But the main reason was because 328k lots of the discretionary fund longs were added during 2024, at prices well below the level at the time, thus remaining in the money.
Gas prices had also rallied significantly in early 2025 and, although hedge funds were enduring a drawdown on their positions, losses had not yet reached a point where risk limits for many funds come into play.
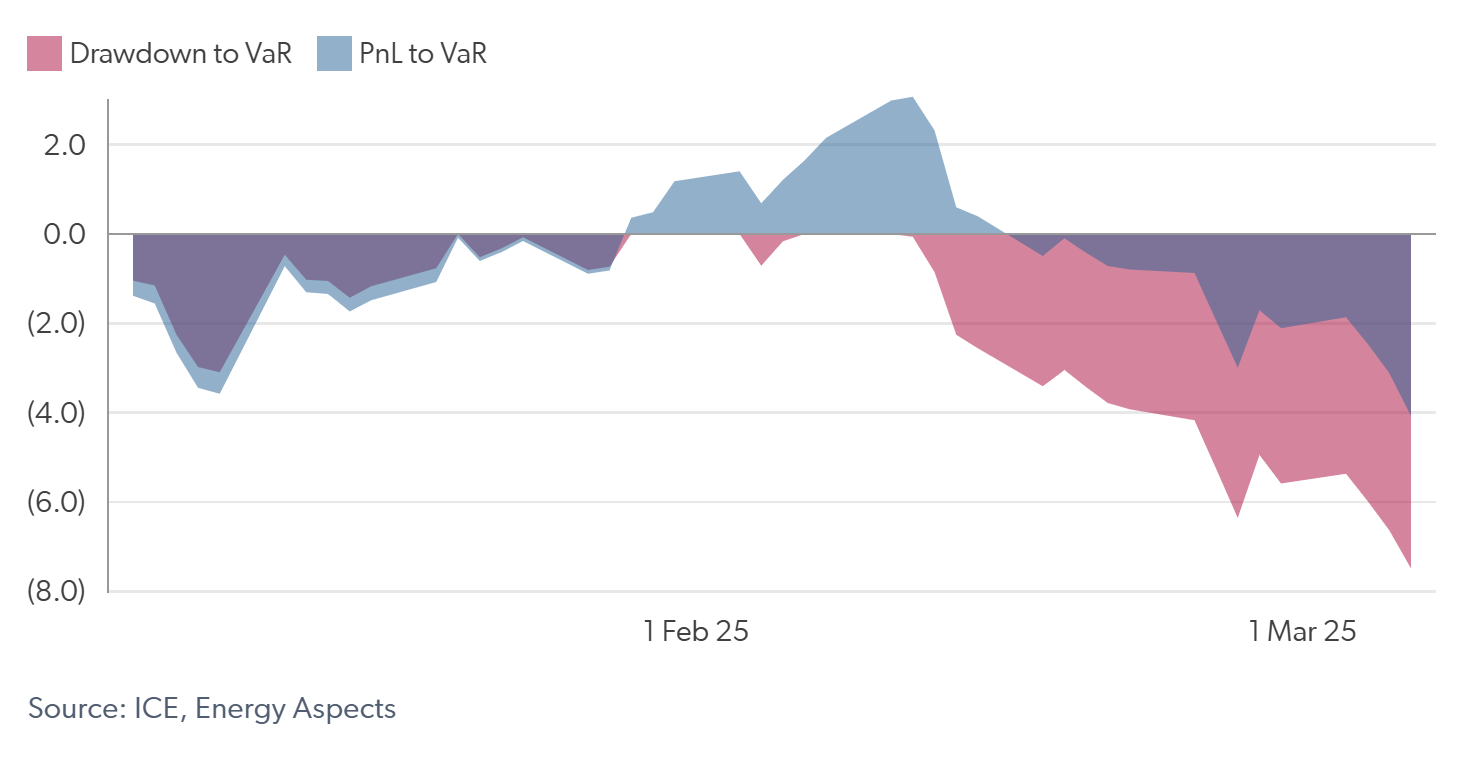
We presented the cumulative discretionary hedge fund PnL and drawdown (from the peak) as ratios of VaR to quantify price drop losses (see Figure 6). At this point, the drawdown ratio from the peak was -2.6 on Friday (14 February), with the PnL to VaR ratio at 0.7 (revised to 0.4 post MiFID data release). We also flagged the €41.00/MWh price level to pose a key risk level where further longs would be forced to close, as this is the price at which PnL to VaR would breach -3.0, the level at which many hedge funds today have risk limits. Note that here we assumed that discretionary funds' VaR limits reset annually (their overall position remained profitable).
Fig 6: Discretionary hedge fund PnL and drawdown as a ratio of VaR
Position exodus
Drawdown constraints finally forced discretionary funds to cut positions in the week commencing 24 February. As prices weakened on storage target–related headlines, the PnL to VaR ratio dropped to -1.6 on Tuesday (25 February), falling further to -2.7 on Wednesday (see Figure 6, revised to -1.9 and -3.0 post MiFID data release, respectively).
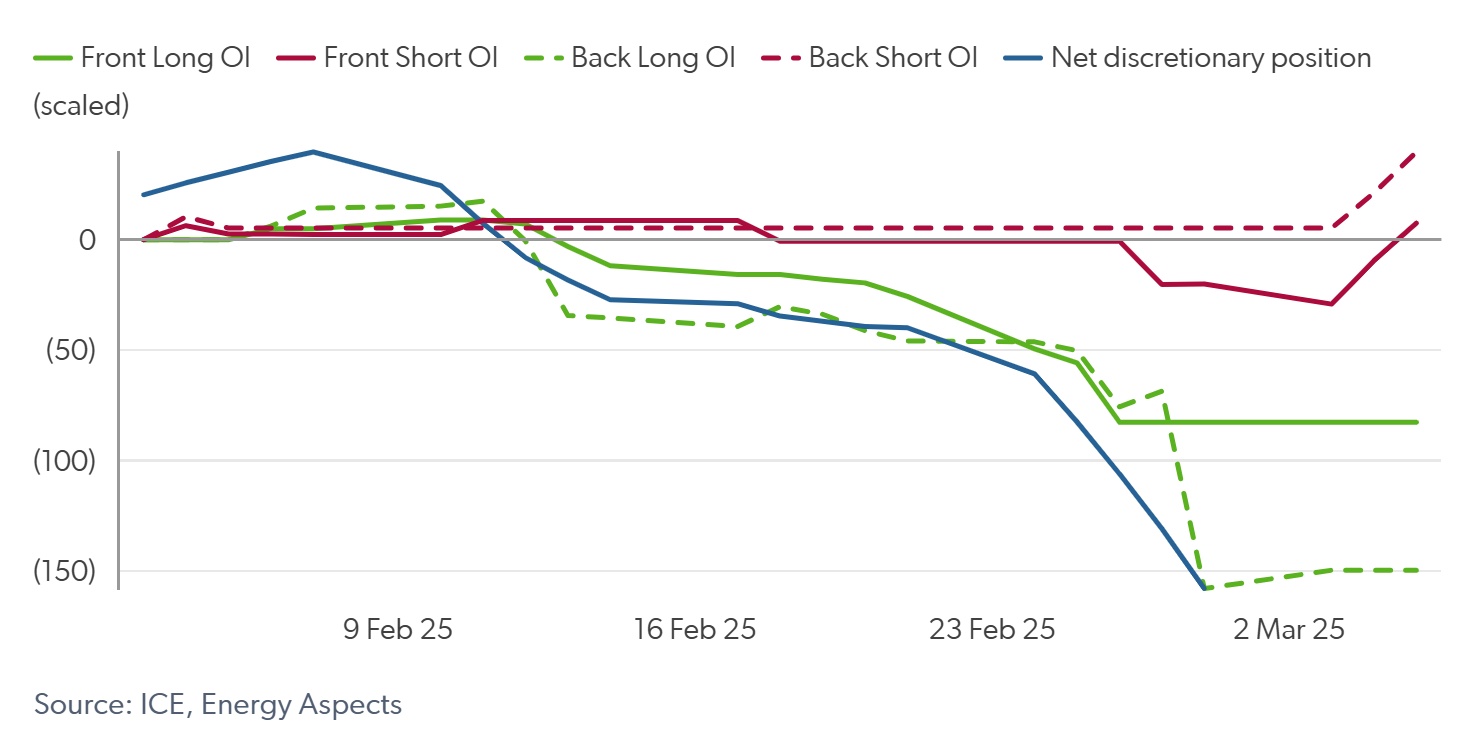
Consequently, many long positions were forced to be closed as risk limits neared, further exacerbating the price drop to near €41.00/MWh in Sum-25. CTA selling and option dealer hedging, risks we continued to flag, also added to the selloff. We estimate long OI decreasing by 33.2k lots from Monday–Wednesday (24-26 February) across the front six contracts, with deferred (after the front six contracts) OI dropping by 29.4k lots in the same period (see Figure 7). The MiFID report released in the week following (w/c 3 March) confirms that discretionary funds cut their net-long position by 65k lots over the course of this week.
Fig 7: Discretionary and front six and back OI longs and shorts, k lots
Conclusion
This insight highlights just how important financial flows can be to pricing in commodity markets, especially when positioning becomes stretched. We’ve continued to see discretionary fund drawdowns increase this week, with the VaR that they hold remaining high despite large position cuts, due to elevated volatility. In the near term, we expect limited bullish participation from discretionary funds given their current deep drawdown and VaR limits, although there is further downside risk from long closures if drawdowns increase further. Conversely, CTAs have potential to support prices, given their maximum-short positioning, along with option dealer flows should prices rally past buying triggers and option open interest concentrations.
Quant as a service
Millennium subscribers get an ongoing dialogue with EA's 12 specialist quant analysts, not just a support desk. We act as a direct extension of your own team.
- Walk-throughs of live examples — interrogate assumptions and challenge the models directly.
- EA Live touchpoints as positioning extremes develop intraday.
- Full methodology published openly — allowing clients to build on EA Quant's work internally.

Chris Alstadt is a Strategic Account Manager at Energy Aspects, with over 15 years of experience in senior sales and global account management. Over the past four years, he has worked closely with some of Energy Aspects’ largest financial clients, including Millennium, Trafigura and Hartree, helping them maximise the value and return on investment derived from Energy Aspects’ research and analytics.
Before joining Energy Aspects, Chris held senior positions at S&P Global and Citywire, where he developed a strong track record in client relationship management, strategic account development, and the cultivation of long-term partnerships.
Request your trial
To find out more about the value you can unlock with Energy Aspects, fill out the form and your dedicated account manager will be in touch shortly!