


The Anatomy of a Stop Out: Financial Flow Analysis in TTF Markets
11 March 2025
Understanding market structure through financial flows
Financial flows play a critical role in market pricing across all asset classes. For traders and risk managers navigating volatile environments, understanding positioning dynamics, liquidity, and risk constraints is essential for effective decision-making. Our research applies this flow-based systematic approach across energy, metals, agriculture, and financial markets, providing crucial
context that fundamental analysis alone cannot deliver.
In early February 2025, discretionary fund net-long positioning in TTF peaked at a record 369k lots at €54/MWh. By March, positioning had dropped 30% to 261k lots, with prices declining to €40/MWh.
The summary below consists of excerpts from recent EA Quant research and highlights how our flow-based analysis enabled our clients to anticipate and manage risks during this significant market shift.
Our quantitative analysis of the TTF market revealed critical warning signals, market conditions ripe for a sharp reversal:
- Discretionary funds reaching all-time high positioning of 369k lots by February 7th, with VaR at €0.66bn (Figure 1)
- Final position increases were driven by options delta accumulation rather than outright futures buying, making them more sensitive to price reversals
- CTAs at maximum-long positioning, a condition our research associates with potential corrections
- Net option delta reaching 690k lots by February 11th, increasing the risk of forced dealer hedging and position unwinding
Risk Assessment Following Market Catalysts
When news broke of a Trump-Putin call on Ukraine negotiations on February 12th, we immediately
flagged specific risks:
- Long-driven open interest in the Sum-25 contract, with VWAP levels between €51.50- 54.75/MWh vulnerable to unwinding
- Gamma concentrations at key downside levels (€55/MWh, €50/MWh, and below) heightened dealer hedging risks,
- Technical levels where larger CTA trend-follower selling would accelerate
Quantifying Position Vulnerability
In our February 20th analysis, we explained why discretionary funds had only reduced positions by 10% despite the initial price drop:
- Most positions remained in profit, having been established at lower price levels
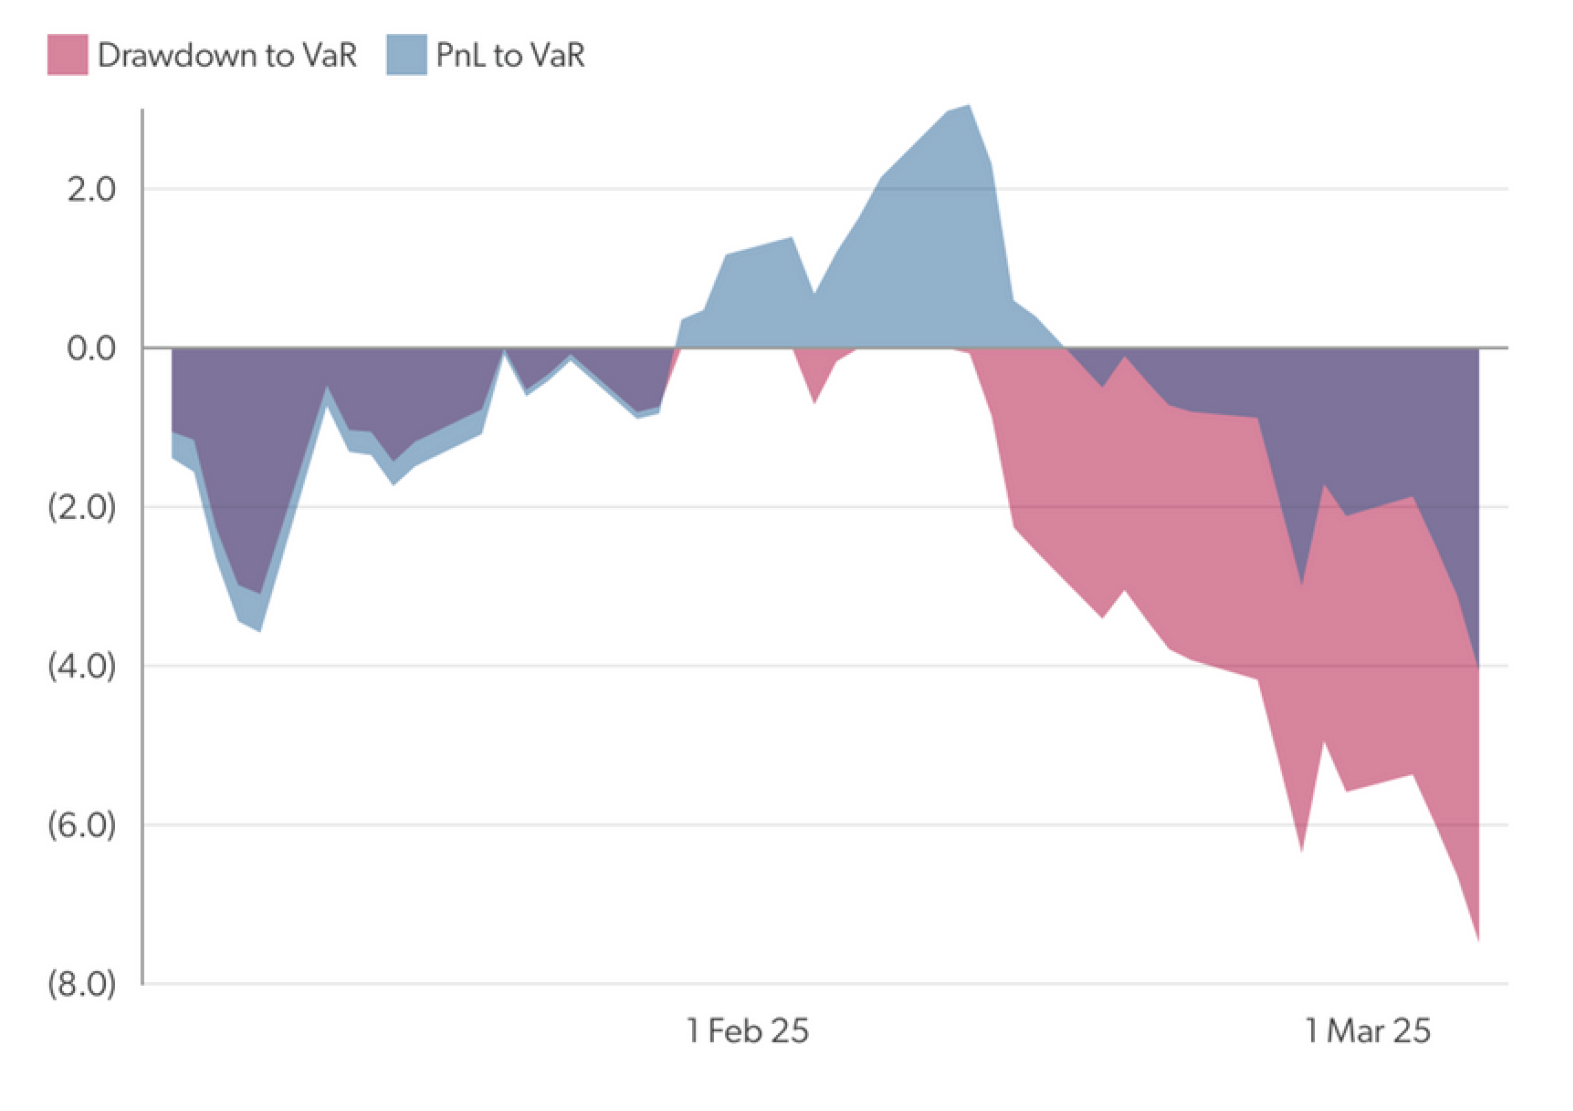
- We presented PnL-to-VaR ratios to quantify position vulnerability (Figure 2)
- €41.00/MWh highlighted as a key risk level where PnL-to-VaR would breach -3.0, a commonrisk limit at mult-strat funds, likely triggering further position reductions.
Position Exodus Analysis
Drawdown constraints forced significant position reductions in late February, as our analysis had indicated:
- PnL-to-VaR ratios deteriorated to -2.7 by February 26th
- Predicted long OI decreases were later confirmed by MiFID data
- CTA selling and option dealer hedging amplified price movements
By early March, discretionary funds had further reduced long exposure, with TTF prices settling near
€40/MWh.
Figure 1: TTF Daily Speculative Length Breakdown, K Lots
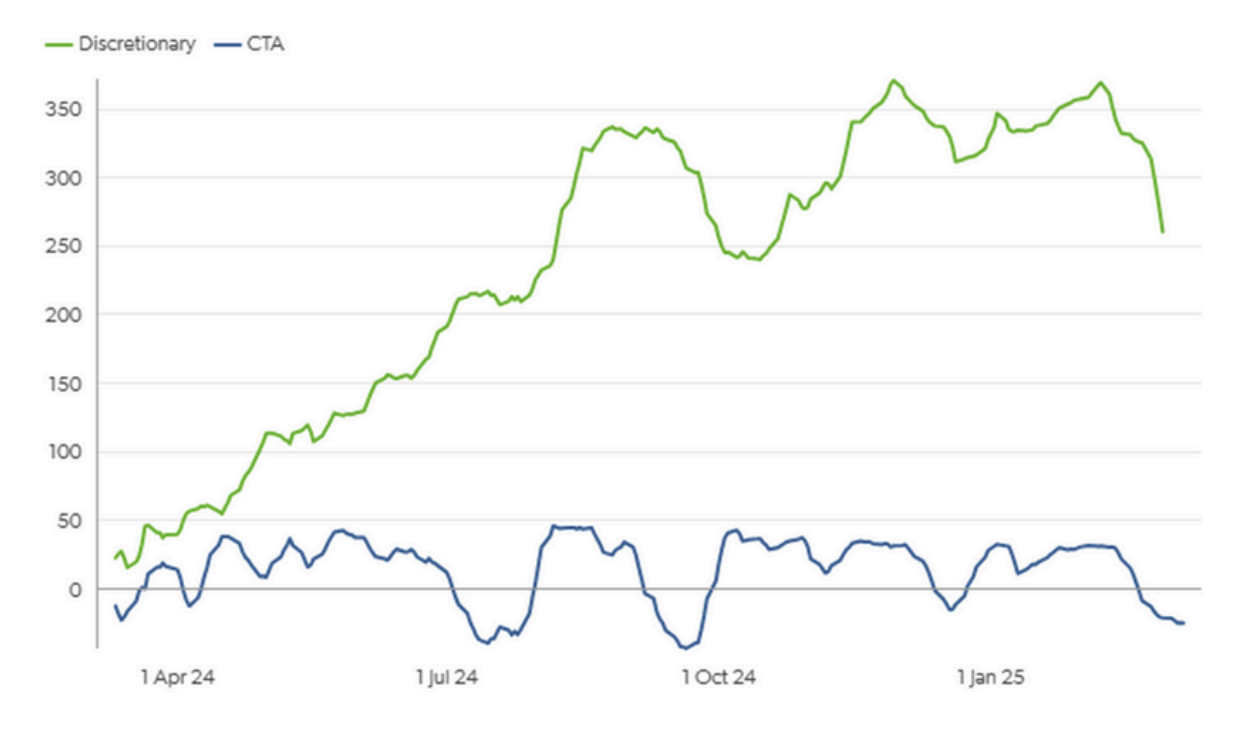
Figure 2: Discretionary hedge fund PnL and drawdown as a ratio of VaR
Related insights