


The anatomy of a stop out - Discretionary funds in TTF Quant Analytics
8 Mar 2025
- Discretionary fund net-long TTF positions peaked at 369k lots on 7 February, declined by 30% after geopolitical developments triggered reductions.
- Trump–Putin call on 12 February triggered significant financial flow risks, causing drop in TTF prices, increased market volatility.
- Discretionary hedge funds only reduced net-long positions by 37k lots, despite 9% price drop; positions remained in the money.
- Drawdown constraints in late February cause position exodus, exacerbating the price decline.
Discretionary fund net-long TTF positioning reached record high of 369k lots on 7 February before experiencing exodus, falling by 30% to 261k lots currently. The build-up of these positions, along with the potential risks of unwinding, is something we have covered in depth in our EA live posts and Gas Quant Weeklies. This insight breaks down all our recent coverage, explaining in detail the financial flow mechanics that have driven TTF prices down by over 30% in the last month.
Market setup
Discretionary funds reinforced their net-long TTF positions from mid-December 2024, with the expectation that Russian gas flows into Ukraine would cease in the new year, which duly materialised. This increase in net-long positions continued until 7 February, at which point they hit an all-time high of 369k lots, with gross notional discretionary Value at Risk (VaR) reaching €0.66bn, the highest level (at the time) since September 2022 (see Figure 1). However, the final increases in the net position was largely driven by an increase in options delta as prices rose (see Figure 2), rather than increased futures positioning (the investment fund category, comprising CTAs and discretionary funds in the MiFID Commitment of Traders report, includes both futures and options delta). As such, options dealers supported prices as they hedged their sold calls by buying the underlying futures.
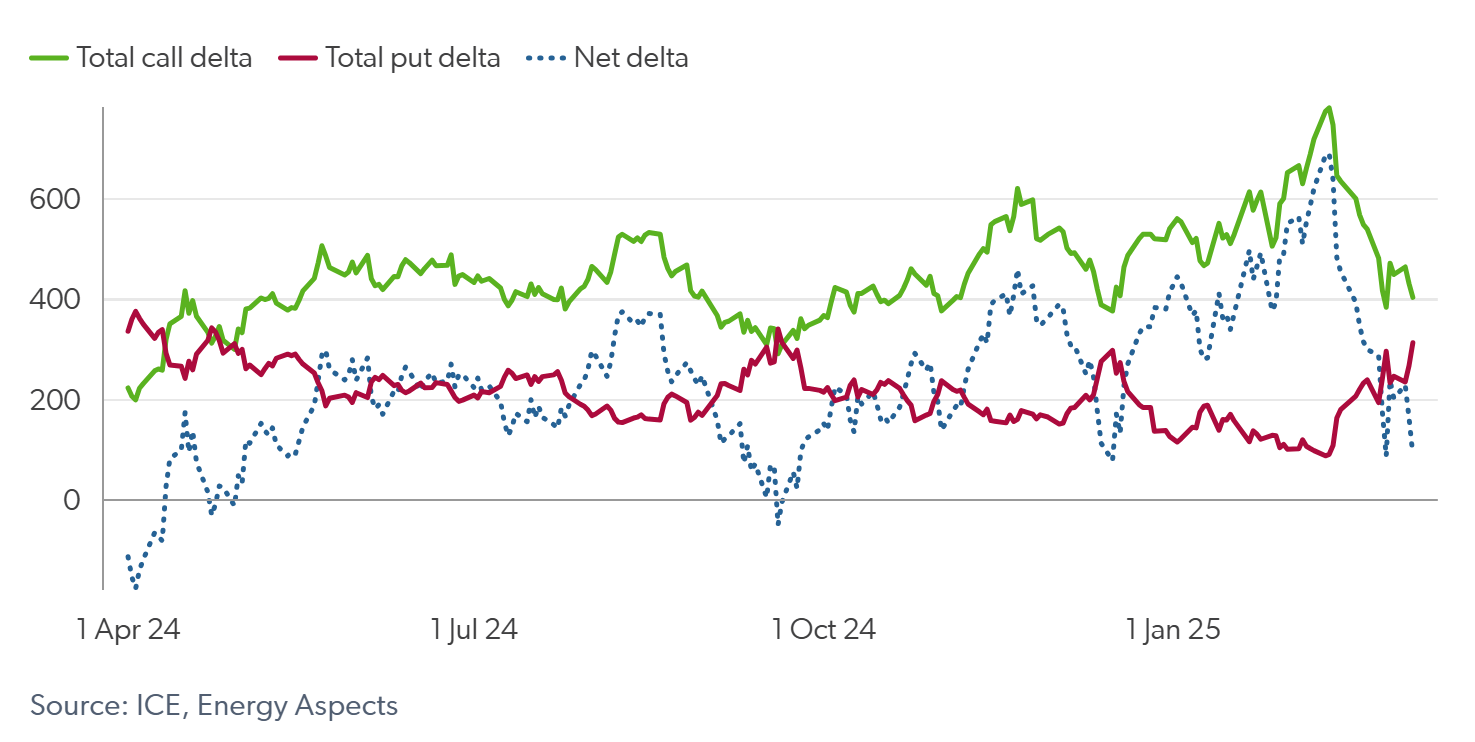
Financial flows were then primed to add to any downside impetus, given how stretched to the long side they had become. CTAs were at maximum-long positioning, with overall positions in crowded territory, which our research shows is often associated with price relief and even reversals. Furthermore, net market option delta hit a high of 690k lots by 11 February, adding the risk of option dealer unwinding to the mix (see Figure 3).
Fig 1: Gross notional discretionary hedge fund VaR, €bn
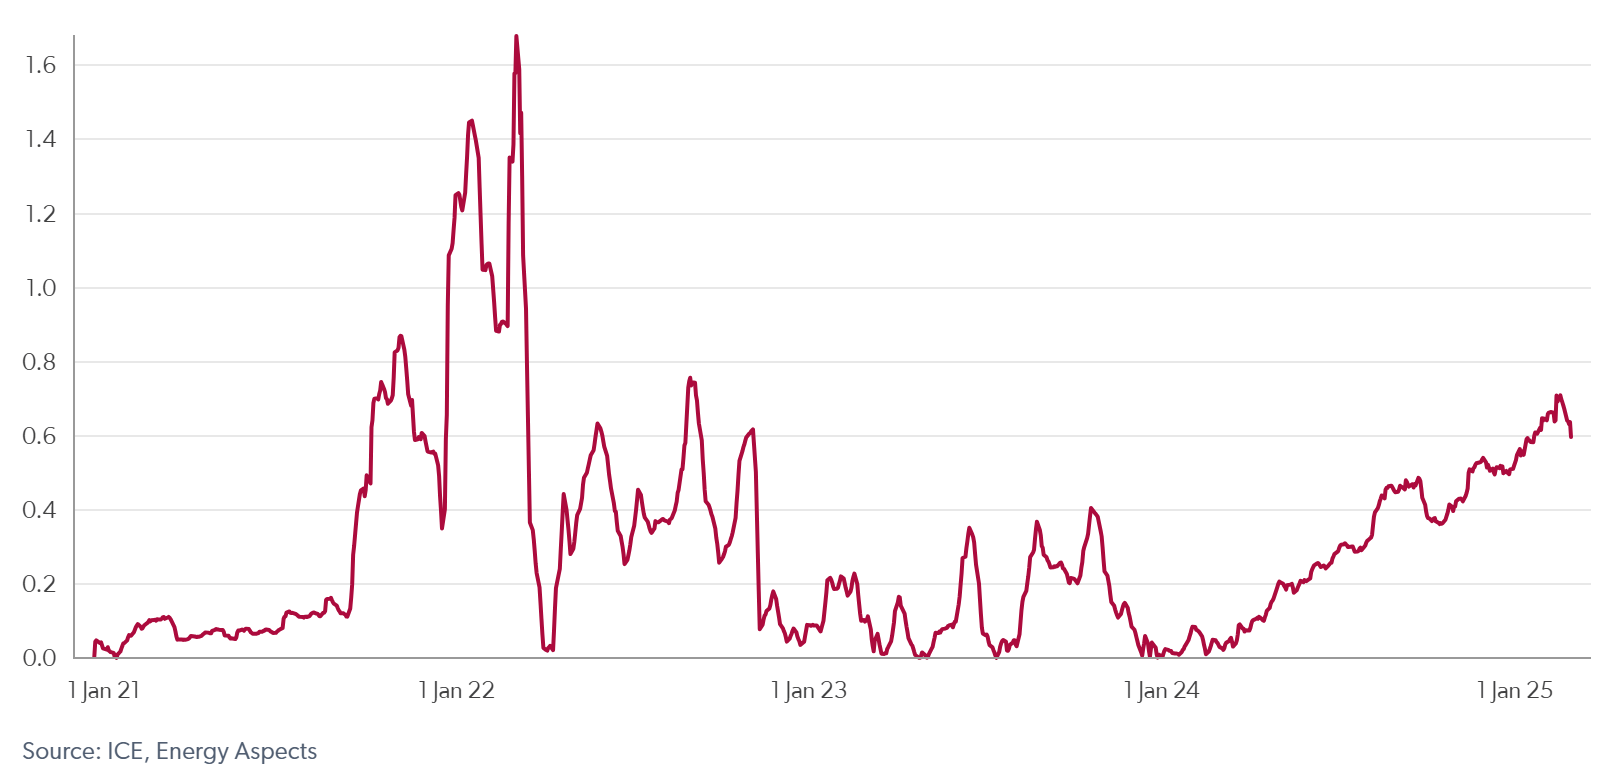
Fig 2: Net total option delta (call–put, scaled) vs discretionary net position (k lots)
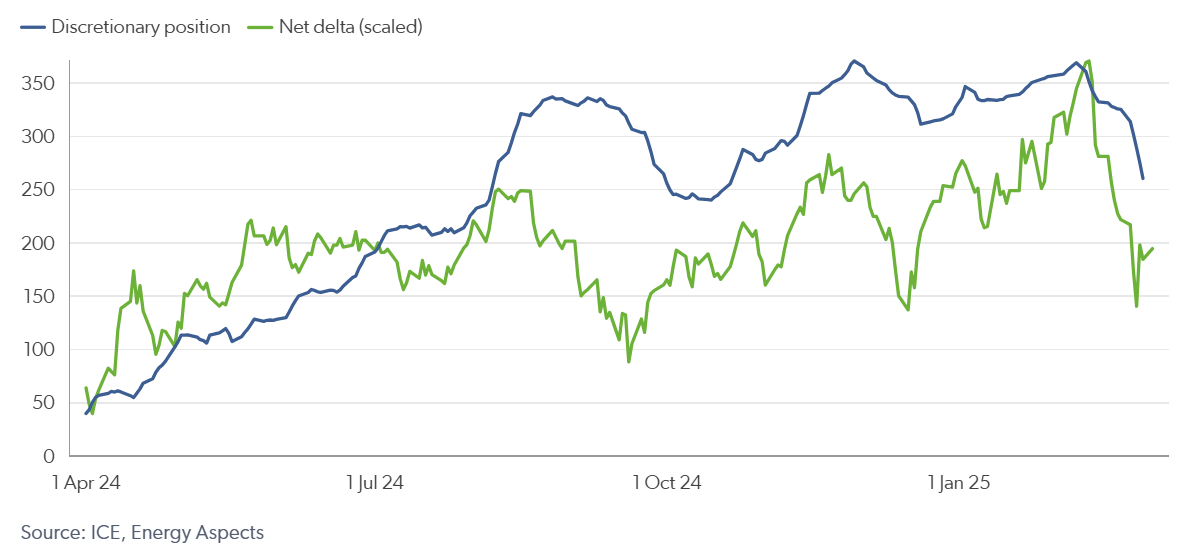
Fig 3: Option market delta, k lots
The catalyst
News broke on 12 February (just after the TTF market closed) that US President Donald Trump had called Russian President Vladimir Putin and agreed to instruct their teams to “start negotiations immediately”. Soon after this, we released an EA live post titled “Net-long TTF speculative positions at risk after Trump–Putin call on Ukraine”. Here we flagged several financial flow risks that would add to downside caused by the news. First, we highlighted the 44k lots of long-driven open interest recently added onto the Sum-25 contract, with VWAP levels between €51.50/MWh and €54.75/MWh (see Figure 4). These price levels posed key-risk levels, as the traders would likely be forced to close these positions as they start drawing down. Additionally, we noted that a large price drop on the market open would result in significant selling from option dealers, particularly around large gamma concentrations through €55/MWh and €50/MWh (see Figure 5), as they reduce their long delta hedges. Finally, we added that CTA selling would pick up if prices moved through the same level, adding further downside risk.
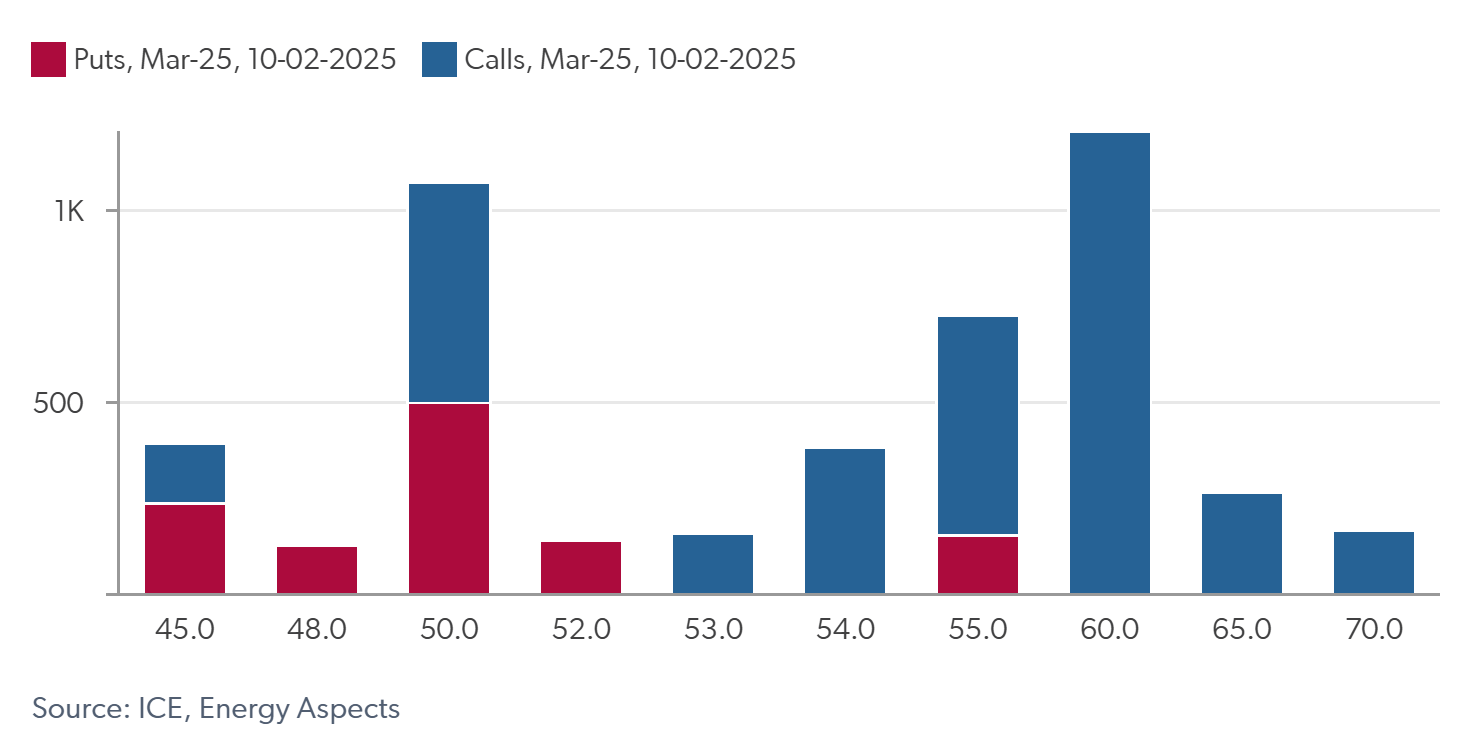
TTF prices dropped by over €4/MWh on 13 February, crossing through many of the key-risk levels we flagged the evening before. Many of the recent Sum-25 longs that we flagged to be at risk were closed out, as reflected in OI decreases and weakening of the Sum-25–Win-25 spread. In our Gas Quant Weekly on that day, we highlighted that further downside was likely given the continued risks. For instance, we flagged that if prices continue to drop, we would expect to see significant selling from option dealers, as their option hedging activity is symmetric. In particular, if prices dropped through €50/MWh, at which 23k (20k) lots of calls (puts) sat in the front month (Mar-25). Furthermore, we flagged large CTA selling levels at €50.50/MWh and €49.50/MWh. We also stressed that prices were already weakening before the news due to factors such as what might be the last cold spell of winter, large volumes of LNG set to arrive in Europe and over-positioning for Sum-25 delivery.
Fig 4: Outright Sum-25 price level €/MWh of open interest changes, k lots
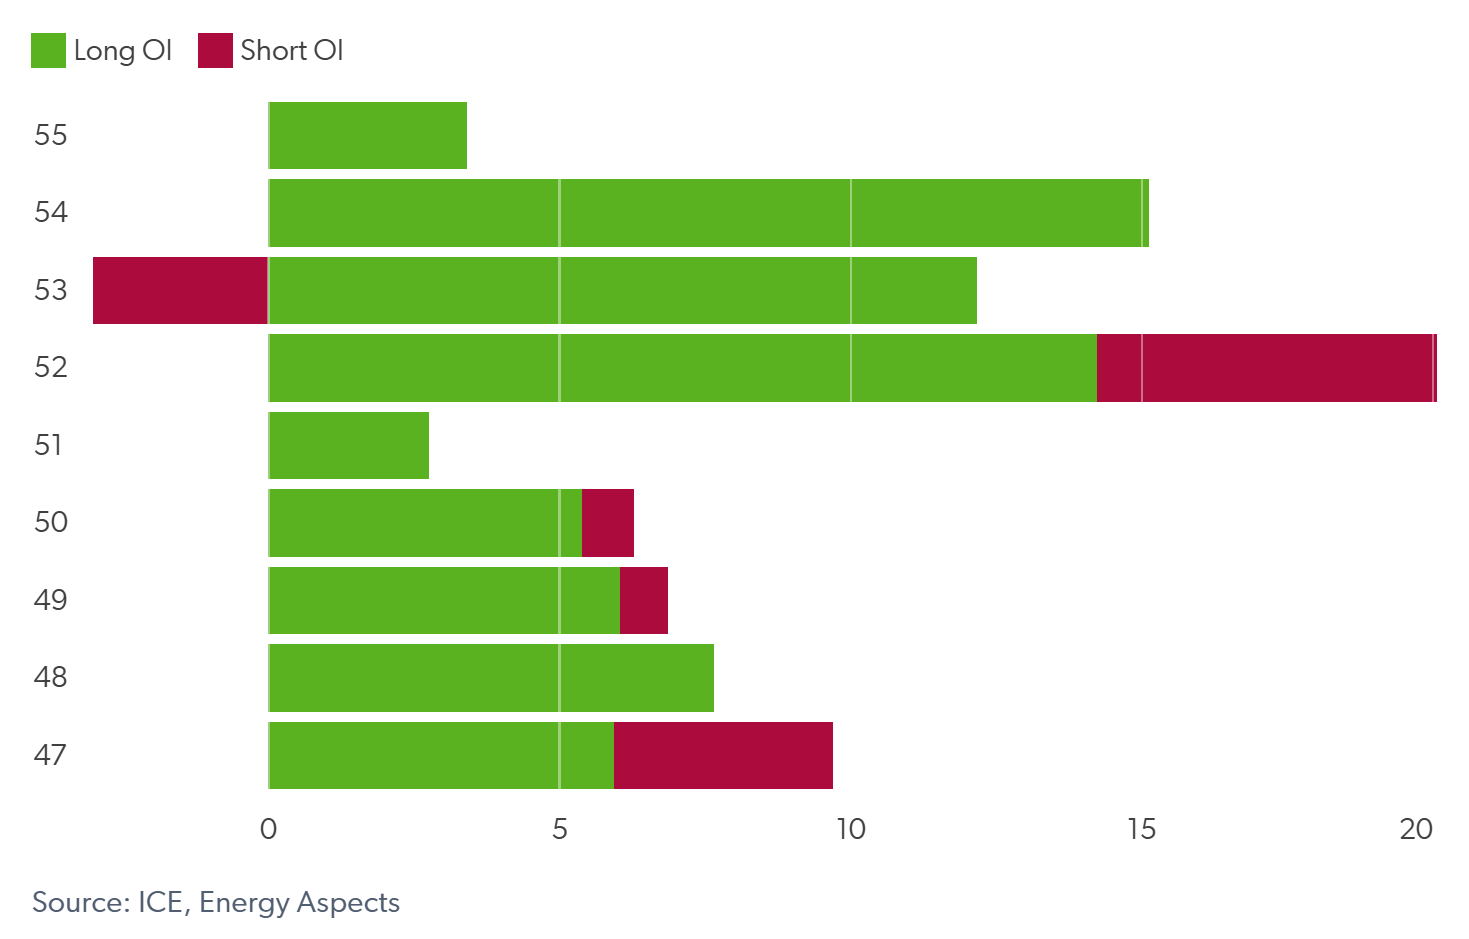
Fig 5: Gamma concentration levels, front month
Sticky longs
Despite prices dropping by 9% in the front from 7–14 February, discretionary hedge funds cut just 37k lots (10%) from their net-long position. This was less than we expected, particularly when factoring in that a large part of this cut was a result of a decrease in options delta. In the following Gas Quant Weekly, published on 20 February, we outlined several reasons for this. One was that some funds were clearly buying the dip with strong resistance points at €54/MWh, adding new longs. But the main reason was because 328k lots of the discretionary fund longs were added during 2024, at prices well below the level at the time, thus remaining in the money. Gas prices had also rallied significantly in early 2025 and, although hedge funds were enduring a drawdown on their positions, losses had not yet reached a point where risk limits for many funds come into play.
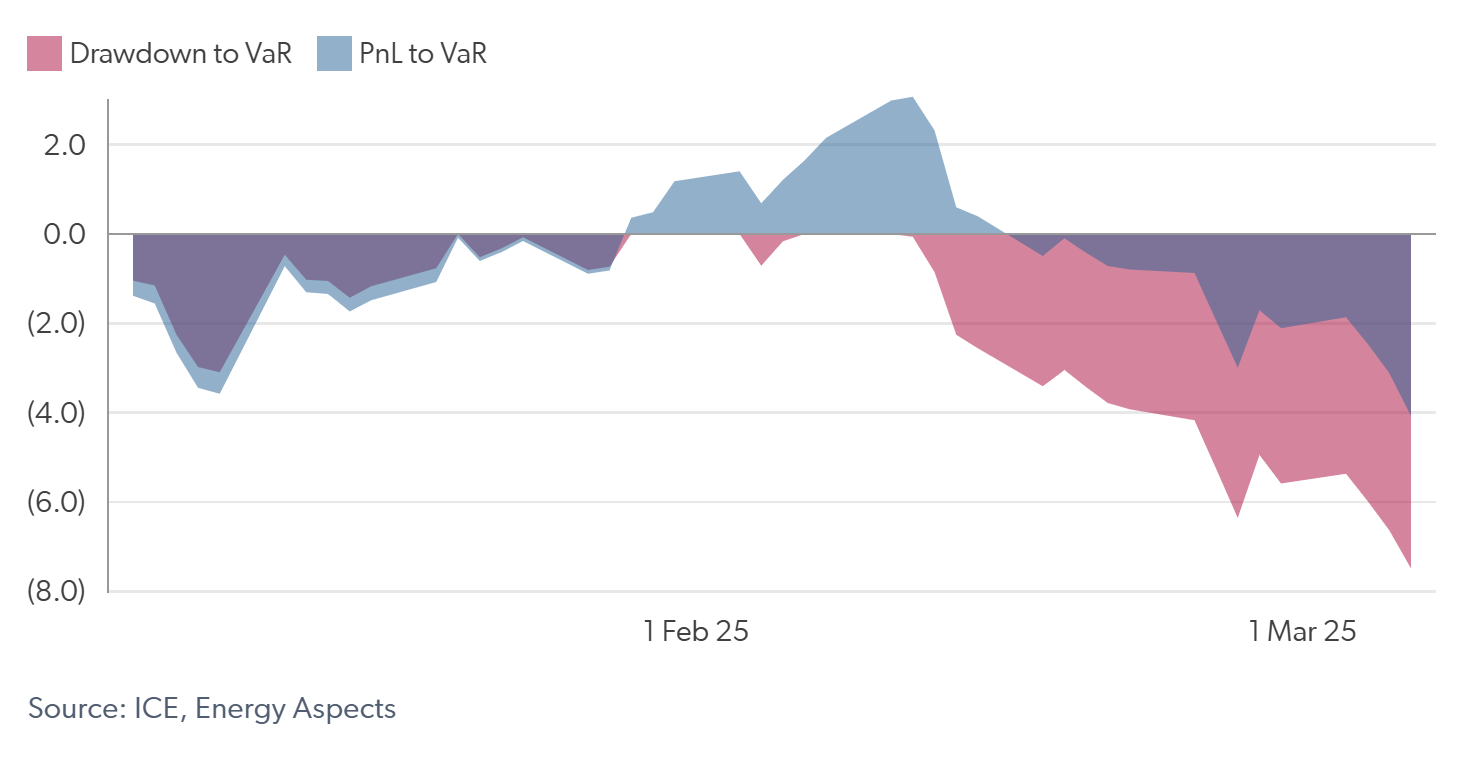
We presented the cumulative discretionary hedge fund PnL and drawdown (from the peak) as ratios of VaR to quantify price drop losses (see Figure 6). At this point, the drawdown ratio from the peak was -2.6 on Friday (14 February), with the PnL to VaR ratio at 0.7 (revised to 0.4 post MiFID data release). We also flagged the €41.00/MWh price level to pose a key risk level where further longs would be forced to close, as this is the price at which PnL to VaR would breach -3.0, the level at which many hedge funds today have risk limits. Note that here we assumed that discretionary funds' VaR limits reset annually (their overall position remained profitable).
Fig 6: Discretionary hedge fund PnL and drawdown as a ratio of VaR
Position exodus
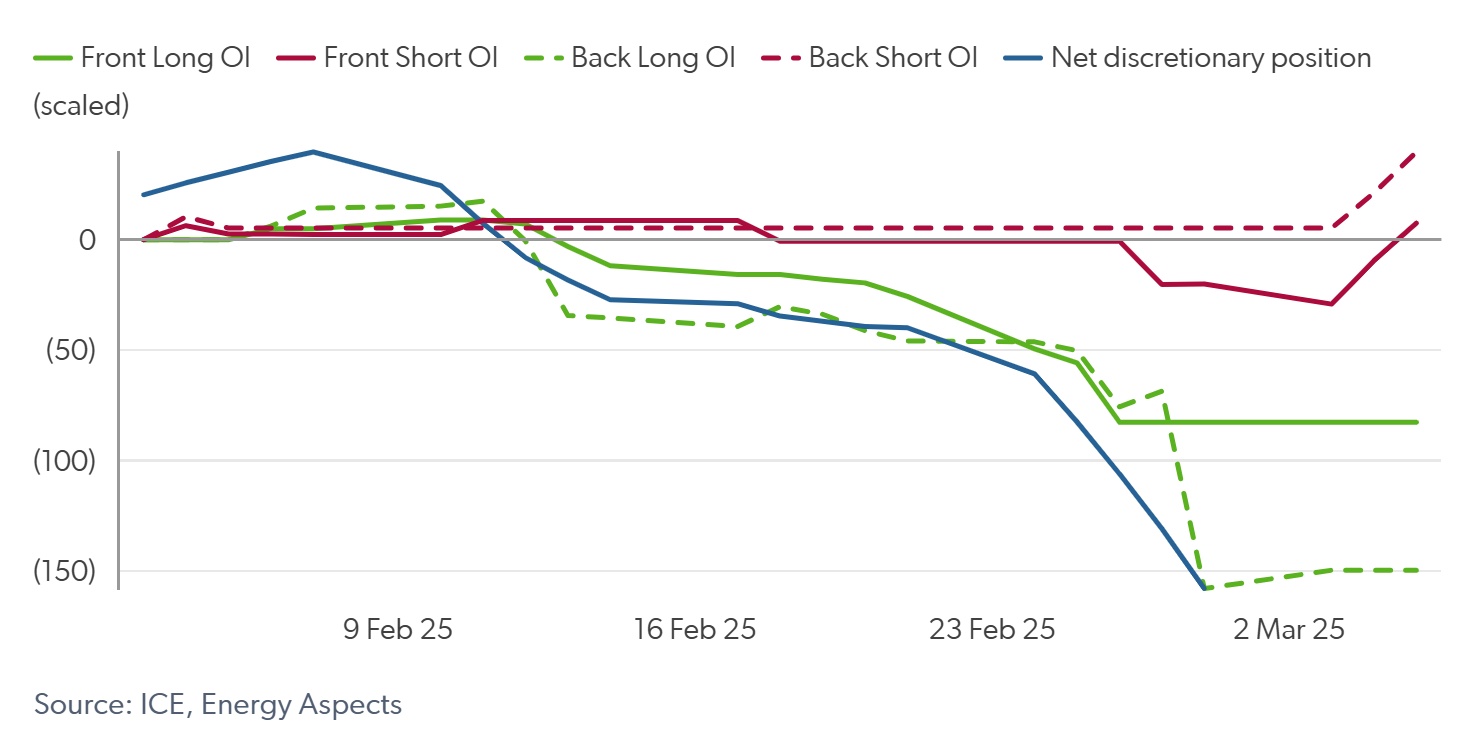
Drawdown constraints finally forced discretionary funds to cut positions in the week commencing 24 February. As prices weakened on storage target–related headlines, the PnL to VaR ratio dropped to -1.6 on Tuesday (25 February), falling further to -2.7 on Wednesday (see Figure 6, revised to -1.9 and -3.0 post MiFID data release, respectively). Consequently, many long positions were forced to be closed as risk limits neared, further exacerbating the price drop to near €41.00/MWh in Sum-25. CTA selling and option dealer hedging, risks we continued to flag, also added to the selloff. We estimate long OI decreasing by 33.2k lots from Monday–Wednesday (24-26 February) across the front six contracts, with deferred (after the front six contracts) OI dropping by 29.4k lots in the same period (see Figure 7). The MiFID report released in the week following (w/c 3 March) confirms that discretionary funds cut their net-long position by 65k lots over the course of this week.
Fig 7: Discretionary and front six and back OI longs and shorts, k lots
Conclusion
This insight highlights just how important financial flows can be to pricing in commodity markets, especially when positioning becomes stretched. We’ve continued to see discretionary fund drawdowns increase this week, with the VaR that they hold remaining high despite large position cuts, due to elevated volatility. In the near term, we expect limited bullish participation from discretionary funds given their current deep drawdown and VaR limits, although there is further downside risk from long closures if drawdowns increase further. Conversely, CTAs have potential to support prices, given their maximum-short positioning, along with option dealer flows should prices rally past buying triggers and option open interest concentrations.
Recent insights