The Anatomy of a Stop Out: Financial Flow Analysis in TTF Markets

11 March 2025


Understanding market structure through financial flows

Financial flows play a critical role in market pricing across all asset classes. For traders and risk managers navigating volatile environments, understanding positioning dynamics, liquidity, and risk constraints is essential for effective decision-making. Our research applies this flow-based systematic approach across energy, metals, agriculture, and financial markets, providing crucial context that fundamental analysis alone cannot deliver.


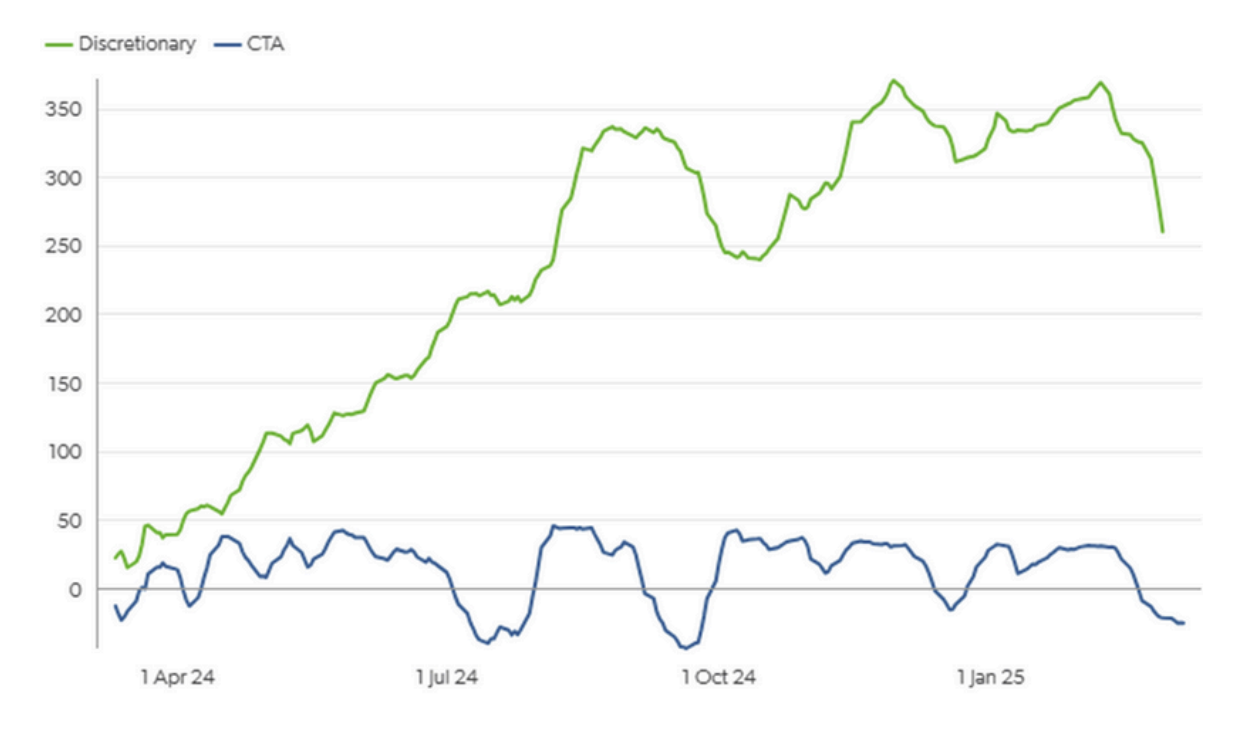
In early February 2025, discretionary fund net-long positioning in TTF peaked at a record 369k lots at €54/MWh. By March, positioning had dropped 30% to 261k lots, with prices declining to €40/MWh.


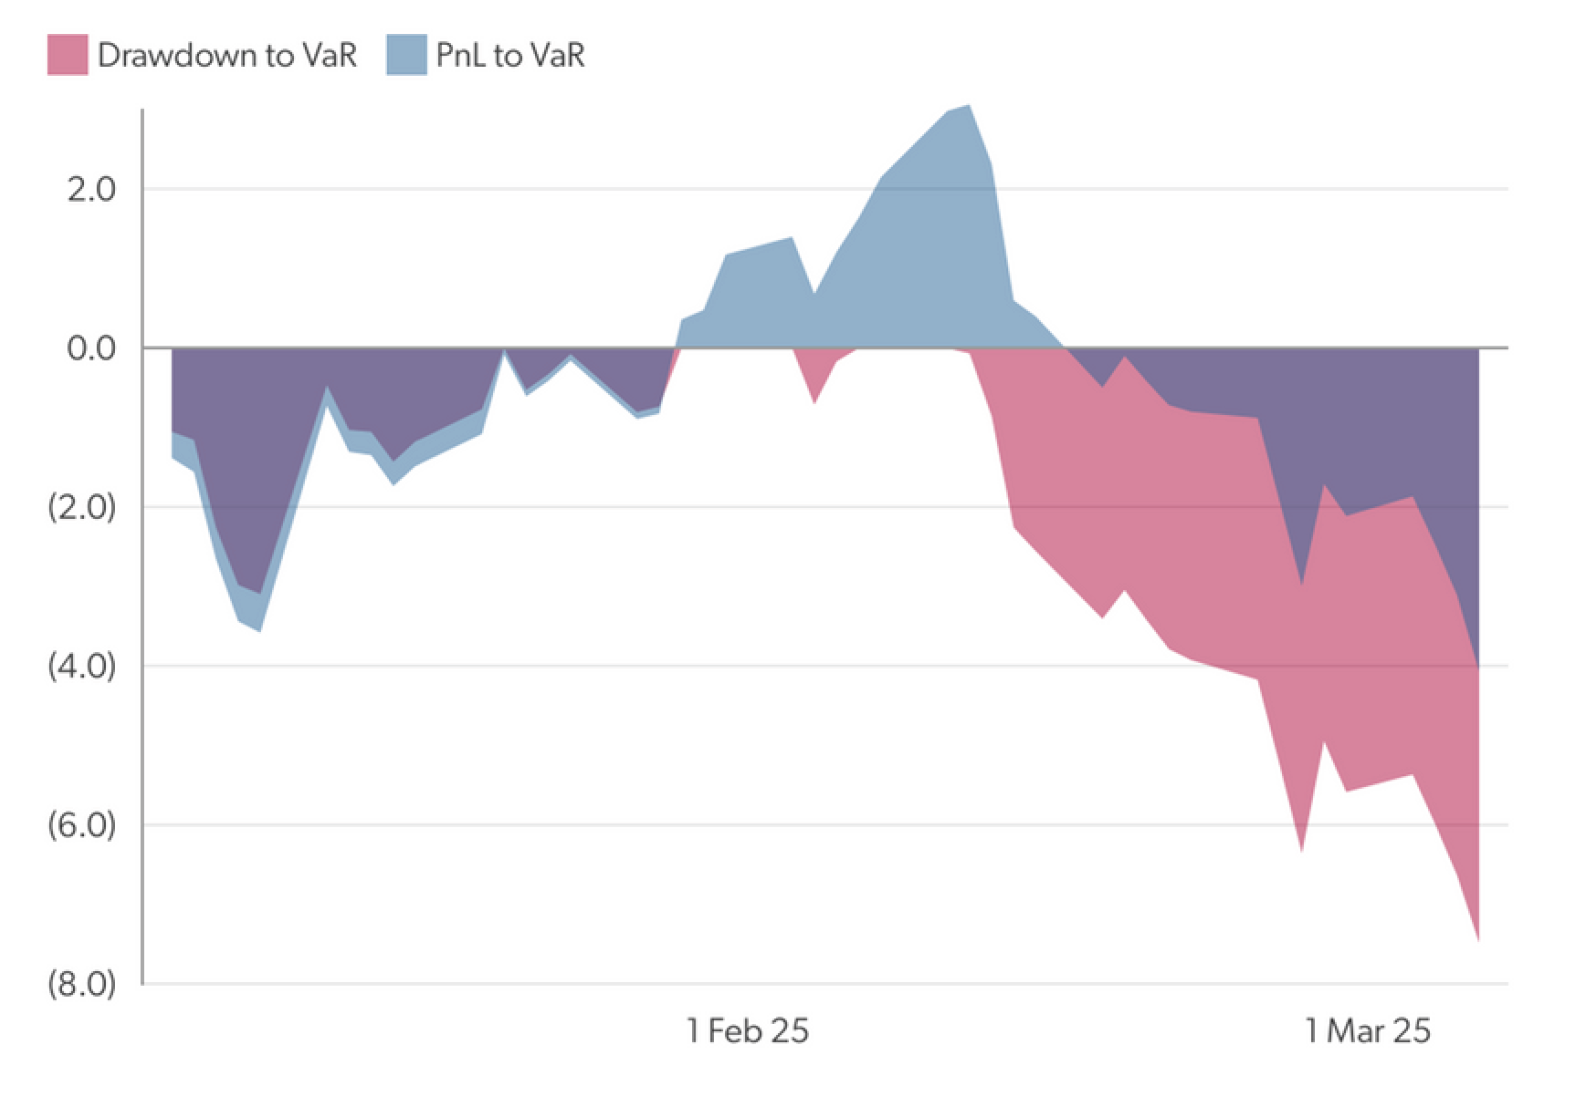
The summary below consists of excerpts from recent EA Quant research and highlights how our flow-based analysis enabled our clients to anticipate and manage risks during this significant market shift.


Our quantitative analysis of the TTF market revealed critical warning signals, market conditions ripe for a sharp reversal:


  • Discretionary funds reaching all-time high positioning of 369k lots by February 7th, with VaR at €0.66bn (Figure 1)
  • Final position increases were driven by options delta accumulation rather than outright futures buying, making them more sensitive to price reversals
  • CTAs at maximum-long positioning, a condition our research associates with potential corrections
  • Net option delta reaching 690k lots by February 11th, increasing the risk of forced dealer hedging and position unwinding


Risk Assessment Following Market Catalysts


When news broke of a Trump-Putin call on Ukraine negotiations on February 12th, we immediately

flagged specific risks:


  • Long-driven open interest in the Sum-25 contract, with VWAP levels between €51.50- 54.75/MWh vulnerable to unwinding
  • Gamma concentrations at key downside levels (€55/MWh, €50/MWh, and below) heightened dealer hedging risks,
  • Technical levels where larger CTA trend-follower selling would accelerate


Quantifying Position Vulnerability


In our February 20th analysis, we explained why discretionary funds had only reduced positions by 10% despite the initial price drop:


  • Most positions remained in profit, having been established at lower price levels
  • We presented PnL-to-VaR ratios to quantify position vulnerability (Figure 2)
  • €41.00/MWh highlighted as a key risk level where PnL-to-VaR would breach -3.0, a common risk limit at mult-strat funds, likely triggering further position reductions.


Position Exodus Analysis


Drawdown constraints forced significant position reductions in late February, as our analysis had indicated:


  • PnL-to-VaR ratios deteriorated to -2.7 by February 26th
  • Predicted long OI decreases were later confirmed by MiFID data
  • CTA selling and option dealer hedging amplified price movements


By early March, discretionary funds had further reduced long exposure, with TTF prices settling near

€40/MWh.

Figure 1: TTF Daily Speculative Length Breakdown, K Lots

TTF graph 1

Figure 2: Discretionary hedge fund PnL and drawdown as a ratio of VaR

TTF graph 1

Recent insights

Sean Maher- Amrita Sen
April 10, 2026
Amrita Sen caught up with Sean M. Maher at Phillips 66, to discuss the medium-term implications of the Iran conflict for oil markets and global energy balances.
Energy Aspects strengthens Refining Analytics
March 24, 2026
The upgraded service gives clients a dynamic view of the global refining system, combining asset data at unit level, operational intelligence, margin analytics
Dr Amrita Sen, caught up with Jeff Currie to discuss disruptions and market denial in the immediate
March 18, 2026
Dr Amrita Sen, caught up with Jeff Currie to discuss disruptions and market denial in the immediate aftermath of the US/Israeli strikes on Iran.