


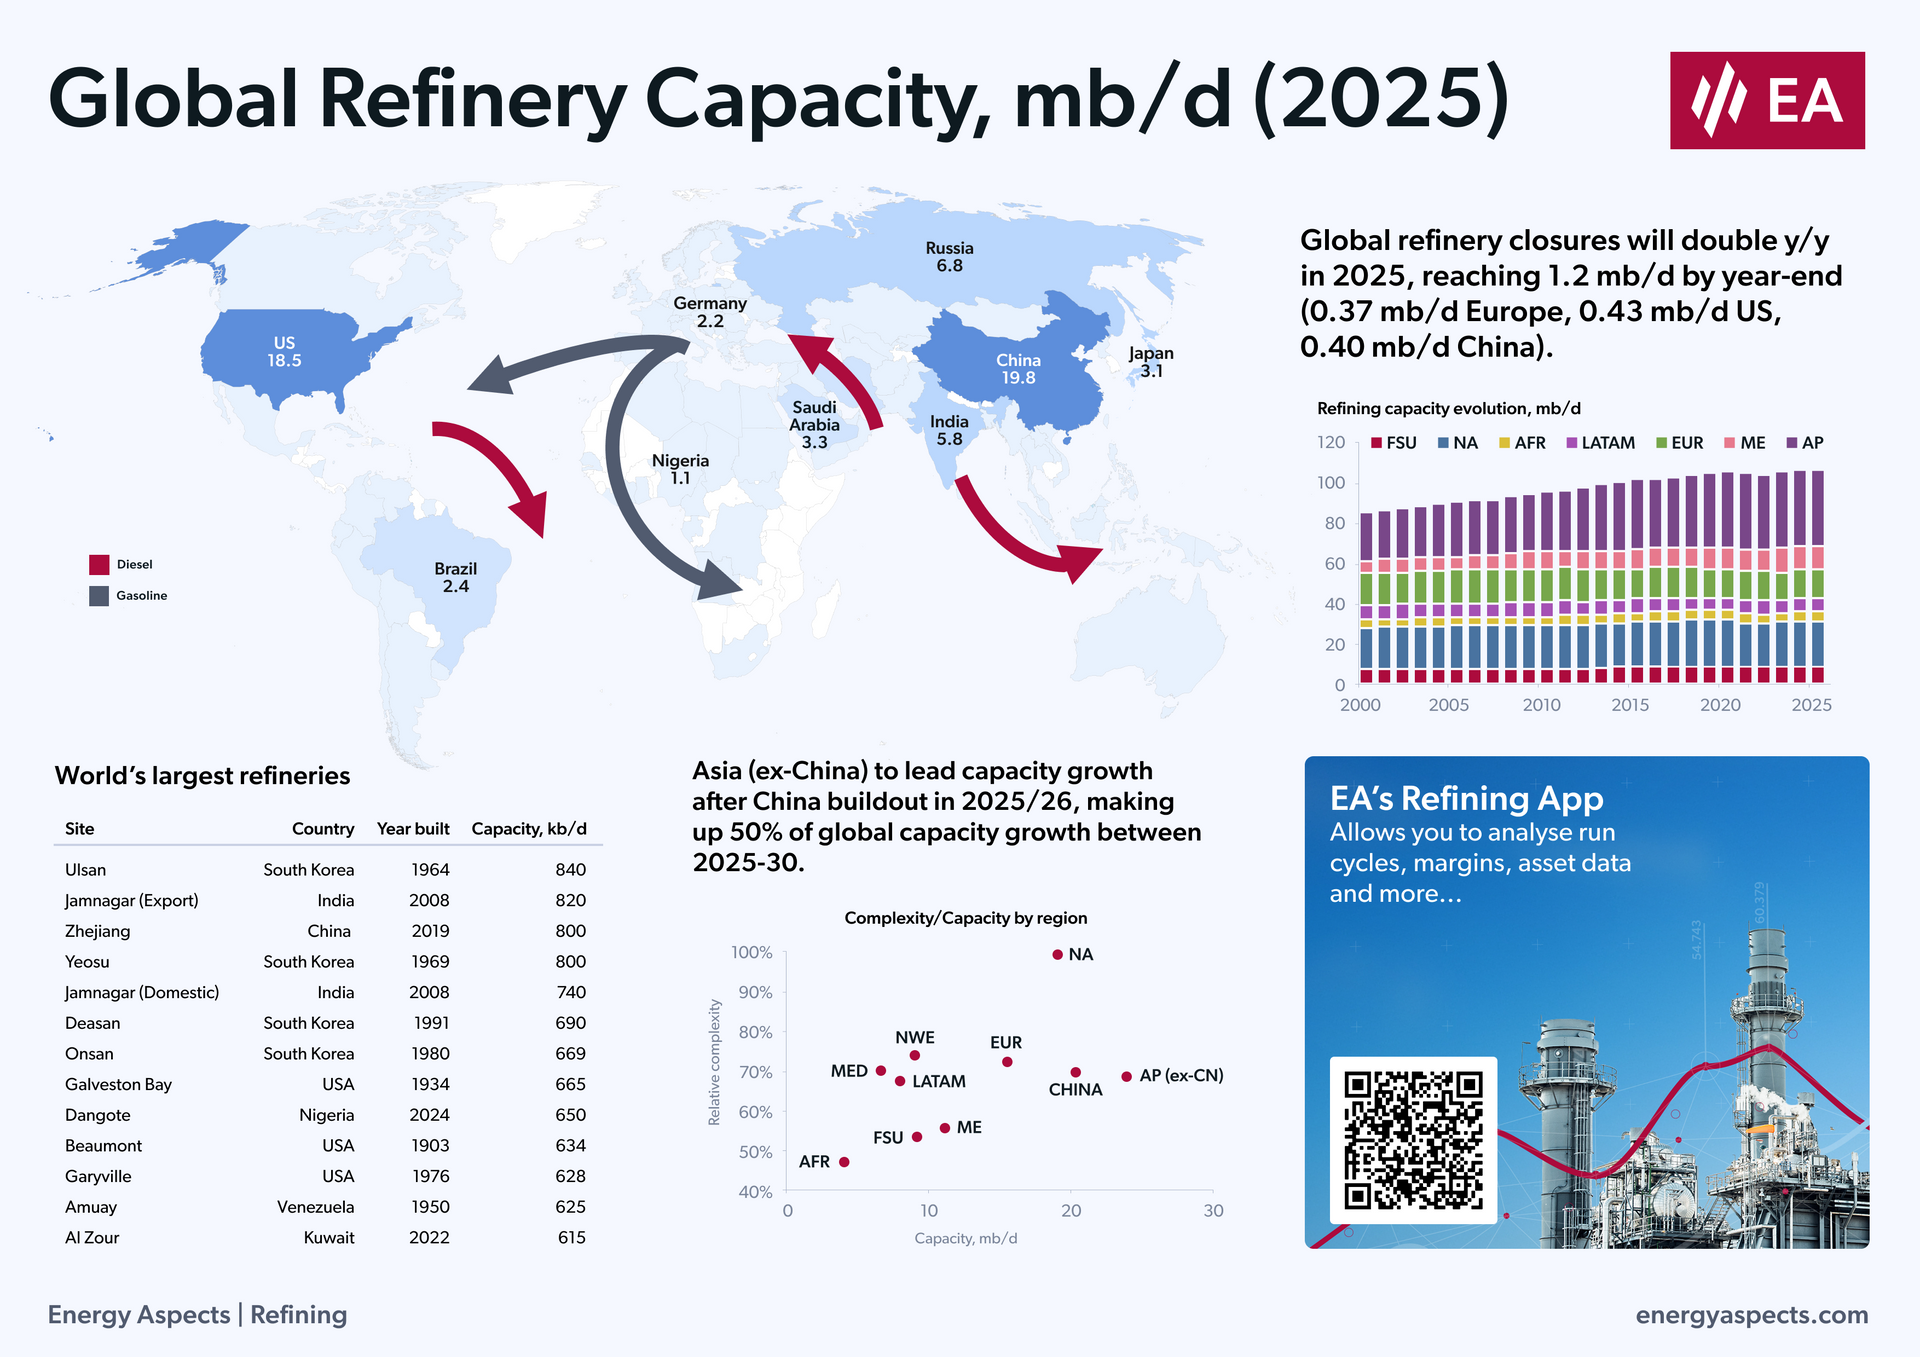
Global Refinery Capacity
In today's volatile energy landscape, staying ahead requires access to critical market intelligence.
Our latest infographic delivers precisely that, a visual breakdown of Global Refinery Capacity that transforms complex data into actionable insights.
Understanding Global Refinery Capacity enables you to assess market dynamics, optimise supply chains, and make informed investment decisions. It provides insights into potential bottlenecks, influences pricing strategies, and helps anticipate shifts in product availability.
Related insights

The OilX Trader Tool translates high-frequency fundamental data into actionable trading signals, helping you anticipate market movements before prices react. By integrating OilX's physical market data with EA Quant Analytics' financial flow positioning metrics, the tool predicts how speculative traders will respond to changing fundamentals over a 1-3 week horizon. View the trader tool in action below:

Recently released for Energy Aspects subscribers, our analysis reveals a challenging outlook for oil field services companies. Q1 2025 earnings for Baker Hughes, Halliburton, and SLB dropped by a third quarter-on-quarter, to a combined $1.7 billion, the first such decline since Q1 2024. What you'll discover in this analysis: Major OFS companies' earnings trends and industry health outlook for 2025. Contrasting performance between tight oil activity and deepwater operations. Tariff implications for OFS supply chains and equipment manufacturing. Regional market performance across North America, Mexico, and Saudi Arabia. Strategic responses to shareholder expectations during market turbulence.

Our latest analysis, first released for subscribers, reveals how EU and IMO emissions regulations will significantly impact LNG bunkering costs and potentially alter global LNG flows. The IMO's surprisingly ambitious Global Fuel Standard could impose penalties of up to $10 million annually on LNG-powered vessels by 2030, whilst the EU's expanding Emissions Trading Scheme will add approximately $0.07/MMBtu to US-Europe shipping costs by 2026. What you'll discover in this analysis: How emissions charges could increase US-Europe LNG shipping costs by $0.40/MMBtu by 2035. Why the EU Methane Regulation will complicate new deals between European importers and US exporters. The potential impact on vessel selection and route economics. How these regulations may influence the Trump administrations trade negotiations.